Monitors
A workflow is configured with a monitor, which is a specialized type of observer to your test suite. A monitor observes test executions, and surfaces information and trends about the test's performance and reliability over time. Workflows are subject to a rate limit. See Rate limit for more information.
Test Engine supports the following types of monitors:
You can alter and reduce the amount of test executions that a monitor receives using tag filters.
Transition count
A transition is a change from passing to failing, or failing to passing, in a sequence of results for a test over time.
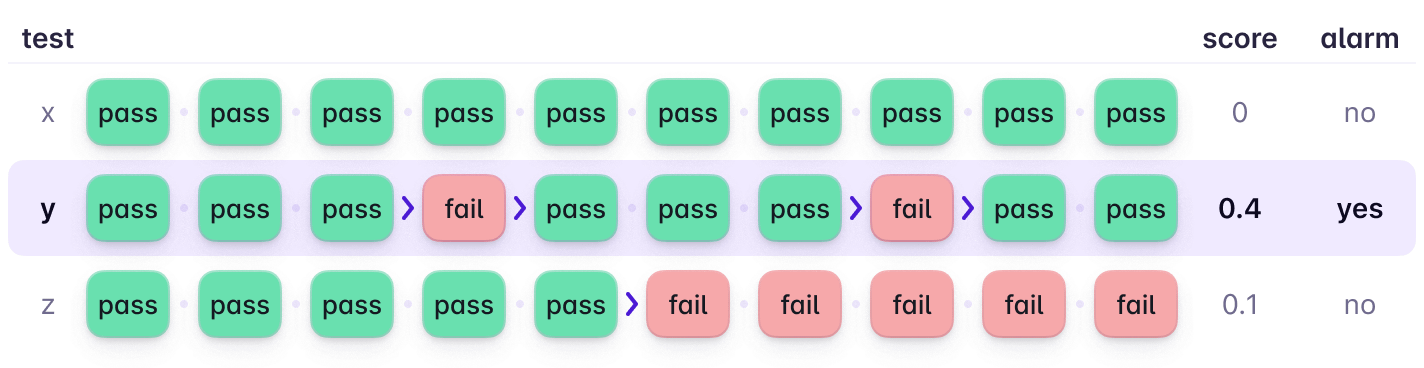
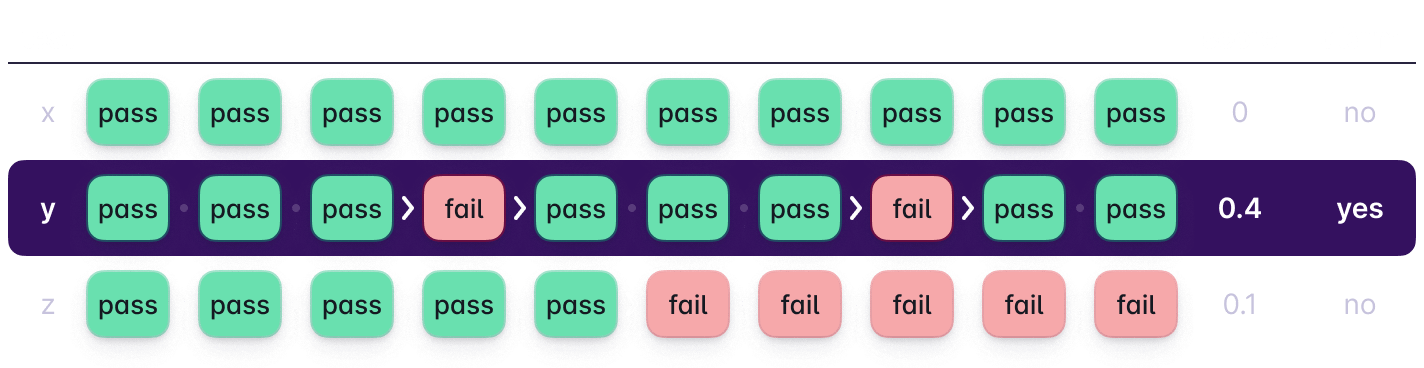
The transition count monitor keeps track of how many times the result changes, over the configured window, and calculates a score based on this. A low transition score means that the test is either consistently passing, or consistently failing. A high transition count for a test indicates flakiness, as the test result is changing very frequently between pass and fail. For example:
- Over a window of 5, a test result pattern of
FFFFFwill have a score of 0. - Over a window of 5, a test result pattern of
PPFFFwill have a score of 0.2. - Over a window of 5, a test result pattern of
PFPFFwill have a score of 0.4. - Over a window of 5, a test result pattern of
PFFFFFwill have a score count of 0 (the oldest resultPhas fallen outside the evaluation window, and so is ignored). - Over a window of 5, a test result pattern of
PFwill have a score of 0.2 (the score is always calculated based on window, not number of results).
In addition to the window, the transition counts that cause the alarm and recover actions to be triggered are configurable.
A branch must be configured for the transition count monitor, and therefore, it is recommended setting this to the value of the main branch (for example, main, master, trunk). Configuring a branch is necessary so that transitions from feature branches are ignored in the accumulation of the transition count, as failures and passes on feature branches are a byproduct of a standard development workflow, and do not indicate test instability.
If you're unsure what the most suitable monitor is for your test suite, use this the transition count monitor on your test suite's default branch. This monitor will likely work without any pipeline configuration changes (for example, setting up job retries), and has more resiliency to "real world" events (for example, infrastructure-related events) which affect test results.
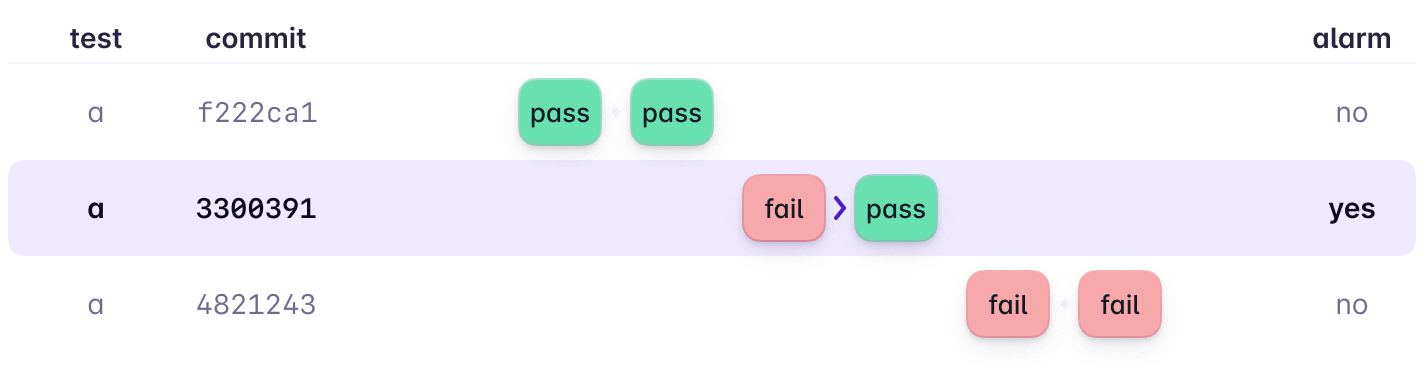
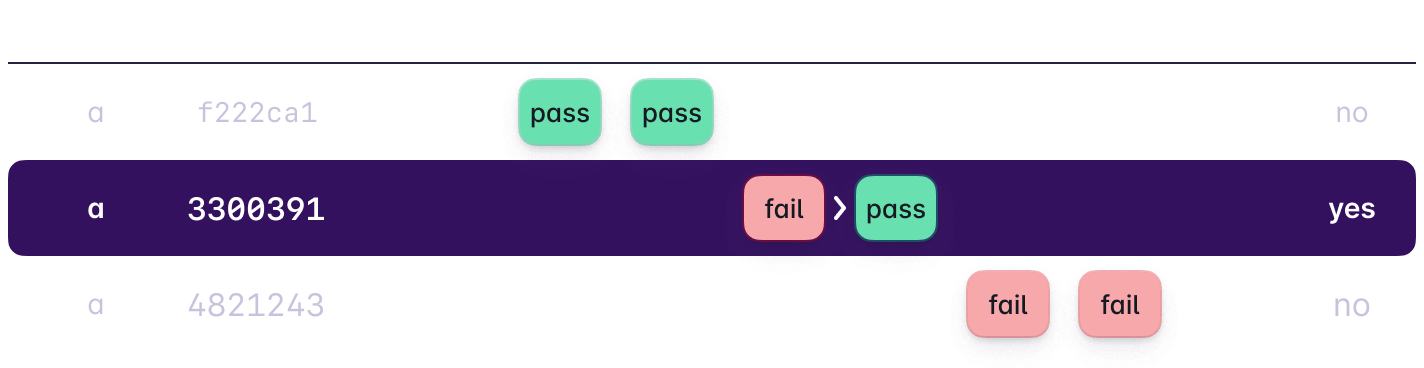
Passed on retry
Passed on retry refers to a test that both passes and fails on the same git commit SHA. When this occurs, the alarm action(s) are triggered. If the monitor then does not encounter passed on retry events over the next seven days or 100 executions of the given test (whichever is reached first), then the recover actions for your workflow will be triggered.
Because this monitor relies on inconsistent results on the same commit SHA, you'll need to set up automatic retries on your test pipeline. You can do this with Buildkite Pipelines retry jobs or by setting the retry count environment variable in Buildkite Test Engine Client.
The order and number of pass and fail results don't change the reportage of the passed on retry event, as long as there is at least one of each pass and fail. Other test results (for example, null, skipped, pending) are ignored in the detection of passed on retry events.
This monitor is created by default for all test suites.
Probabilistic flakiness
This monitor tracks the probabilistic flakiness score (PFS) of each test. The PFS was developed by Meta, and uses a Bayesian statistical model to derive the probability that a test will become flaky on its next execution. The PFS model takes into account the current result of the test, and the historical results of the test execution.
The probabilistic flakiness monitor is only available on Enterprise plans.
The probabilistic flakiness monitor is best suited to large and complex test suites, where the volume and noise of test data prevents a simpler flaky test monitor from being successful. As the PFS is a continuous metric, these scores provide a smarter prioritization metric for larger organizations.
New test
The new test monitor is in beta. The recover actions are not yet available.
The new test monitor triggers when a test executes for the first time and becomes a managed test. A test is considered new only if the combination of its scope and name is unique and has not previously existed. If a test executes for the first time but its scope and name match an existing managed test, the monitor does not trigger.
You can configure the new test monitor to trigger actions that help track and manage the performance and reliability of new tests to prevent flaky tests from being introduced to your test suite.
Duration threshold
The duration threshold monitor tracks how long individual tests take to run. The monitor triggers when the aggregated duration over a sliding window crosses a configured threshold. Use this monitor to identify tests that exceed an acceptable runtime.
The monitor maintains a rolling window of recent execution durations for each test. The monitor calculates the aggregated duration across the window and compares it to the configured thresholds:
- When the aggregated duration is greater than or equal to the alarm threshold, an alarm action is triggered.
- When the aggregated duration is less than or equal to the recover threshold, a recover action is triggered.
Configuration
Configure the following when setting up a duration threshold monitor:
-
Aggregation function: The function used to aggregate execution durations within the window. Only
p50(median) is currently supported. - Evaluation window: The number of most recent executions used to calculate the aggregated duration. Accepts integers up to 100. Default: 5.
- Alarm threshold: The duration, in seconds, that triggers an alarm action.
- Recover threshold: The duration, in seconds, that triggers a recover action. Must be lower than the alarm threshold.
Like the transition count monitor, the duration threshold monitor is most useful when pointed at a single branch. Configure a branch tag filter set to your default branch so that variance from feature branch executions does not affect the monitor. Without a branch filter, longer-running executions on feature branches can inflate the aggregated duration and cause spurious alarms.
Tag filters
Tag filters reduce the set of execution data that goes into a monitor, so that you can ignore lower relevancy data and produce better insights, or take different actions based on different types of test executions. This means that you can set up custom actions and monitors based on tag values, for example, sending different notifications based on different team tag values, or using tags to segment the different types of test (for example, feature, unit) and monitor on different thresholds.
Tag filters are optional and you can configure up to four of them per workflow. Tag filter values support the following matching operators:
- is
- is not
- starts with
If you haven't set up tags for test execution, see Tags in the Test suites documentation for details.
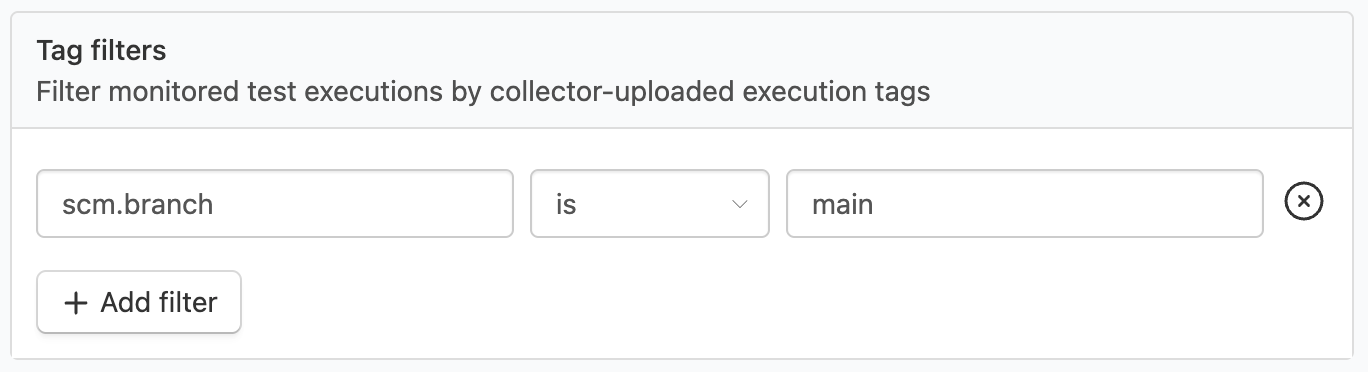
Default branch filter
By default, a filter for scm.branch is added, whose value is set to your default branch. This means that test instability on feature or development branches, or both, do not affect the reliability of your test suite. You may want to modify or remove this default branch filter if your organization meets any of the following criteria:
- Your organization is interested in test results on a specific branch, that is not your default branch. For example, your organization uses test selection and full test builds are run on a specific branch.
- Your organization uses merge queues, and is interested in branches following the merge queue naming convention.
- Your organization is interested in monitoring all branches.
Remove the branch filter if you want to monitor on all branches. The branch filter must be set to a value if you're using the transition count monitor.