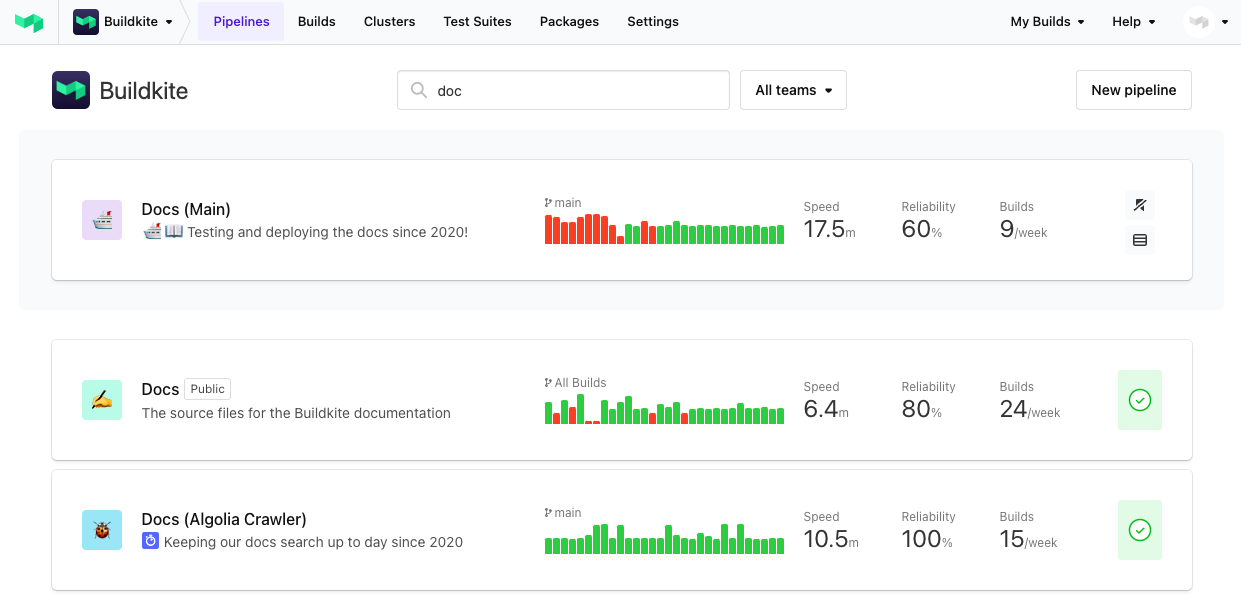
Dashboard walkthrough
Once you've set up a few pipelines and have run some builds, you can see an overview of them on the dashboard. Each pipeline has a set of metrics to give you an overview of its health and performance.
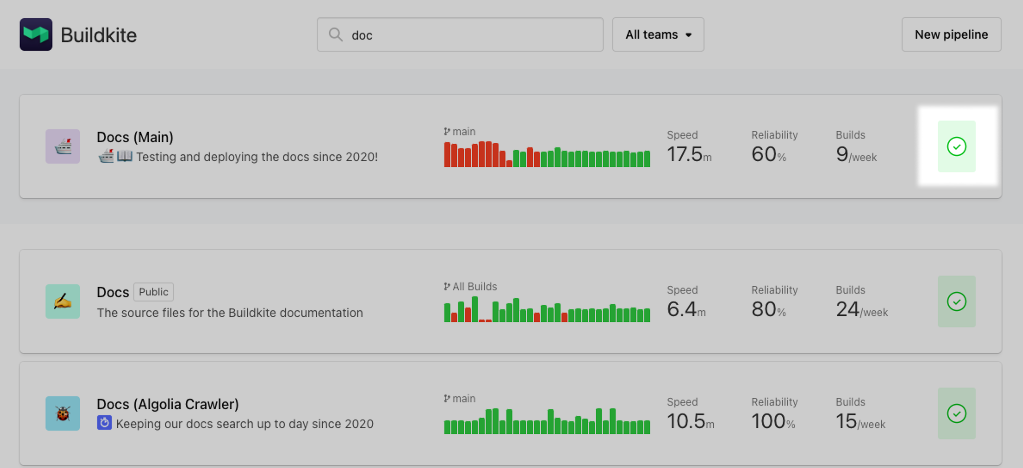
Pipeline status
A visual indication of your pipeline's current status. This icon is based on the latest build on your default branch.
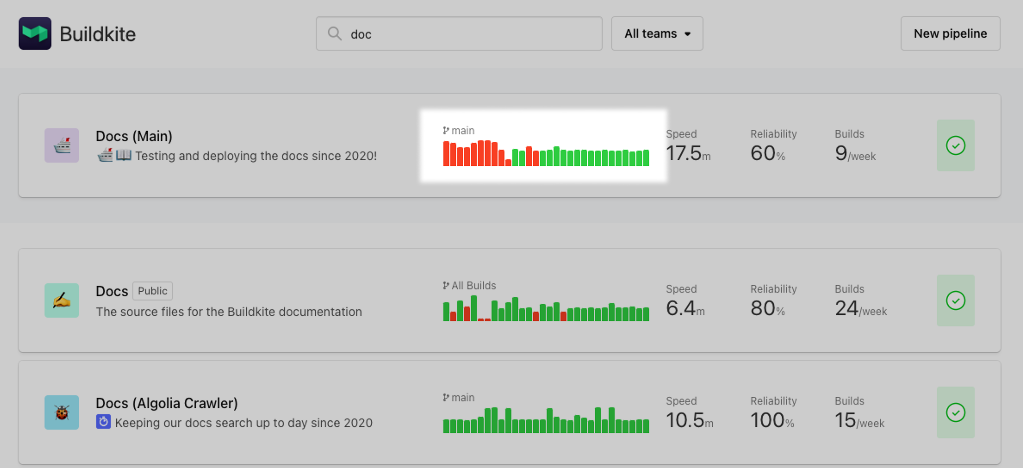
Build history
The build history visualizes the last 30 builds that have been run on your default branch. The height of each bar reflects the build's running time, and its status is represented by its color and in the tooltip on hover.
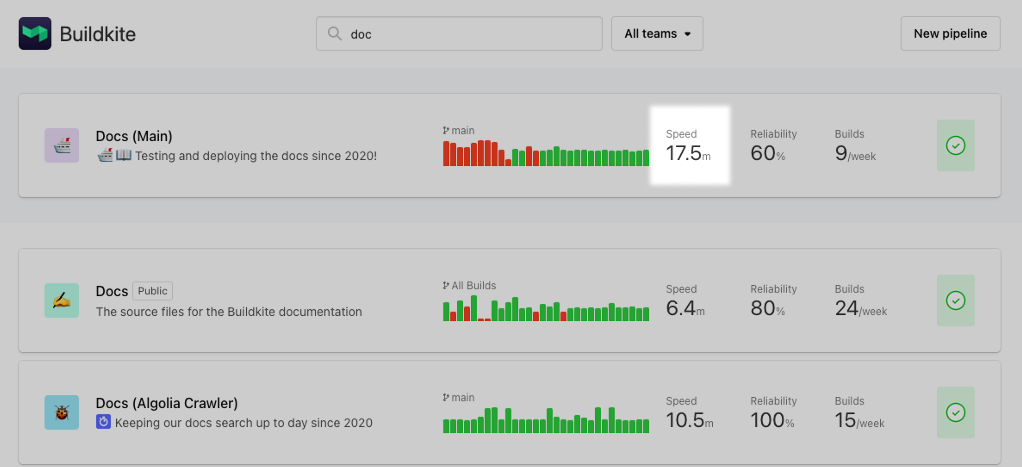
Speed
The speed of your pipeline is calculated from the average of your 30 most recent builds. This helps you keep an eye on your pipeline's speed, and compare performance between pipelines.
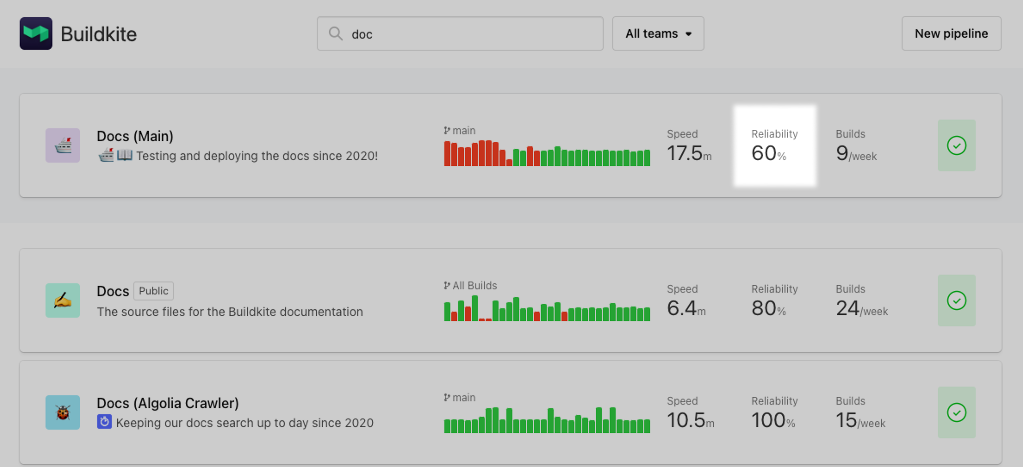
Reliability
The reliability of your pipeline is a calculation based on passing vs failing builds over the last 30 days. This metric helps you to understand the overall stability of your pipelines.
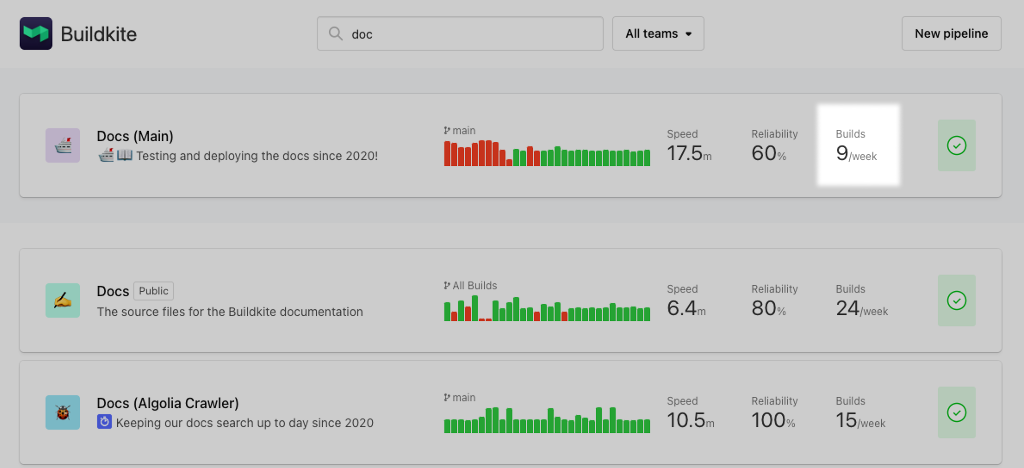
Builds per week
The builds per week measurement is calculated based on the average number of builds created over the past 4 weeks on the pipeline's default branch. This metric helps you to understand how frequently a pipeline is run. Note that if the pipeline's default branch setting is left blank (that is, None for no default branch), then this metric is calculated on all branches of this repository.
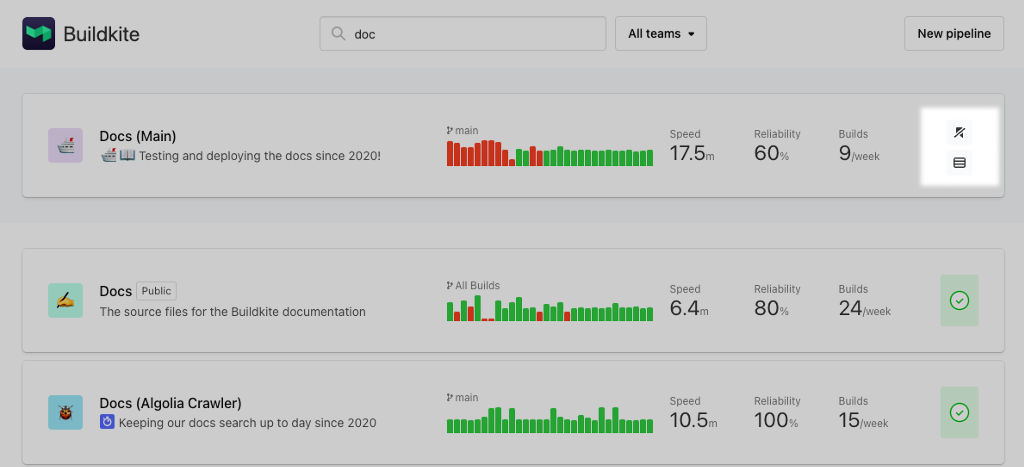
Bookmarking pipelines
You can keep your most used pipelines at the top of the page by hovering over a pipeline, and selecting the bookmark icon on the right.
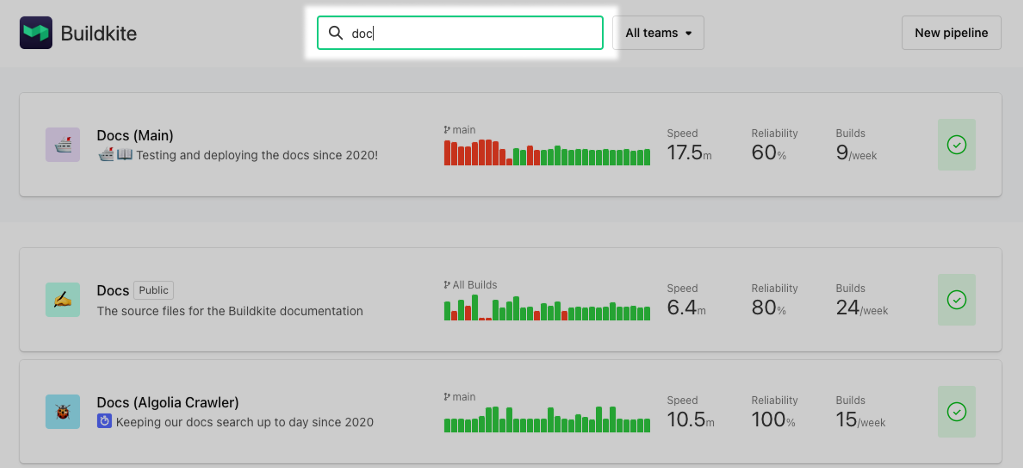
Filtering pipelines
You can filter pipelines using the search bar at the top of the page. This will search the titles of pipelines, and return all those matching your search terms.
You can add tags to your pipelines and use them to quickly filter pipelines using the search bar. You can manage a pipeline’s tags in the pipeline's Settings section.
A dropdown at the top of the dashboard lets you switch between active and archived pipelines. If your organization has Teams enabled, the dropdown also lets you filter by team. The dropdown defaults to All teams when teams are available. Selecting a specific team filters the list to pipelines accessible by that team.
Customizing the page
You're able to edit a pipeline's: - name - description - emoji - color - repository - default branch
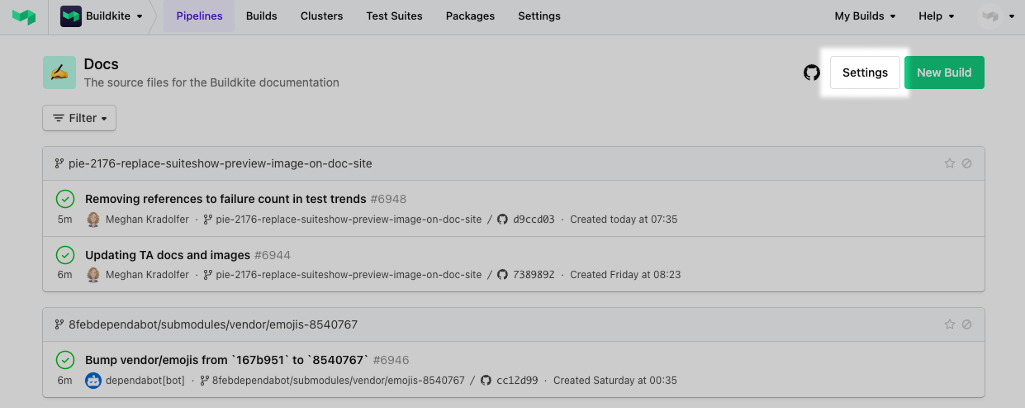
After you've selected a pipeline, the settings button is in the top right corner.
The display settings can be found in the pipeline's Settings section. Adding a description, emoji, and color for your pipeline is optional, but name, repository, and default branch are all required.
The emoji and color will replace the icon on the dashboard. Descriptions also have full emoji support. 🙌
Pipeline page
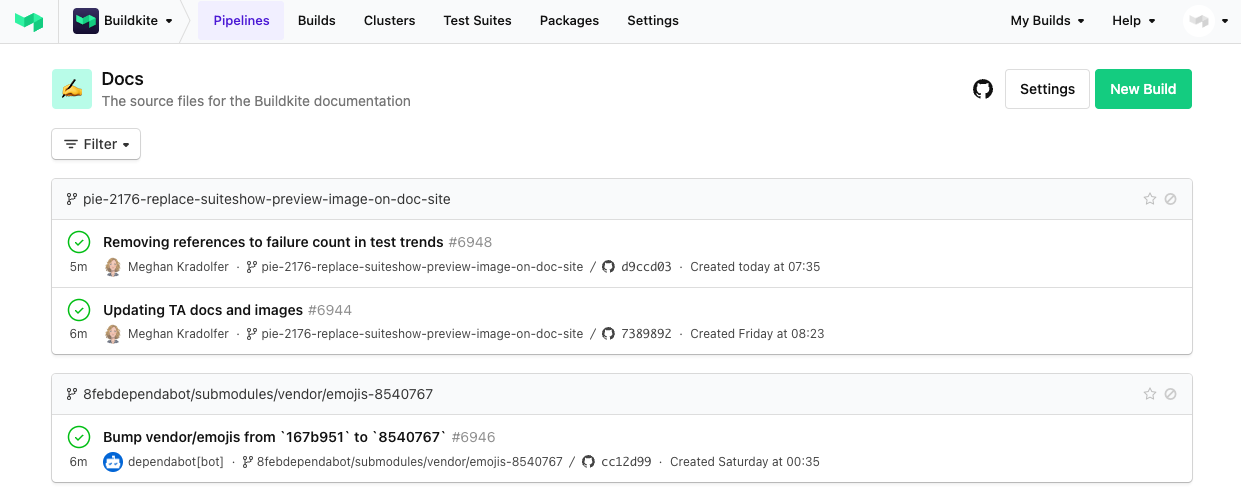
Select a pipeline to view its page, which shows the build history for that pipeline, your starred branches, and the ten most recently built branches for that pipeline.
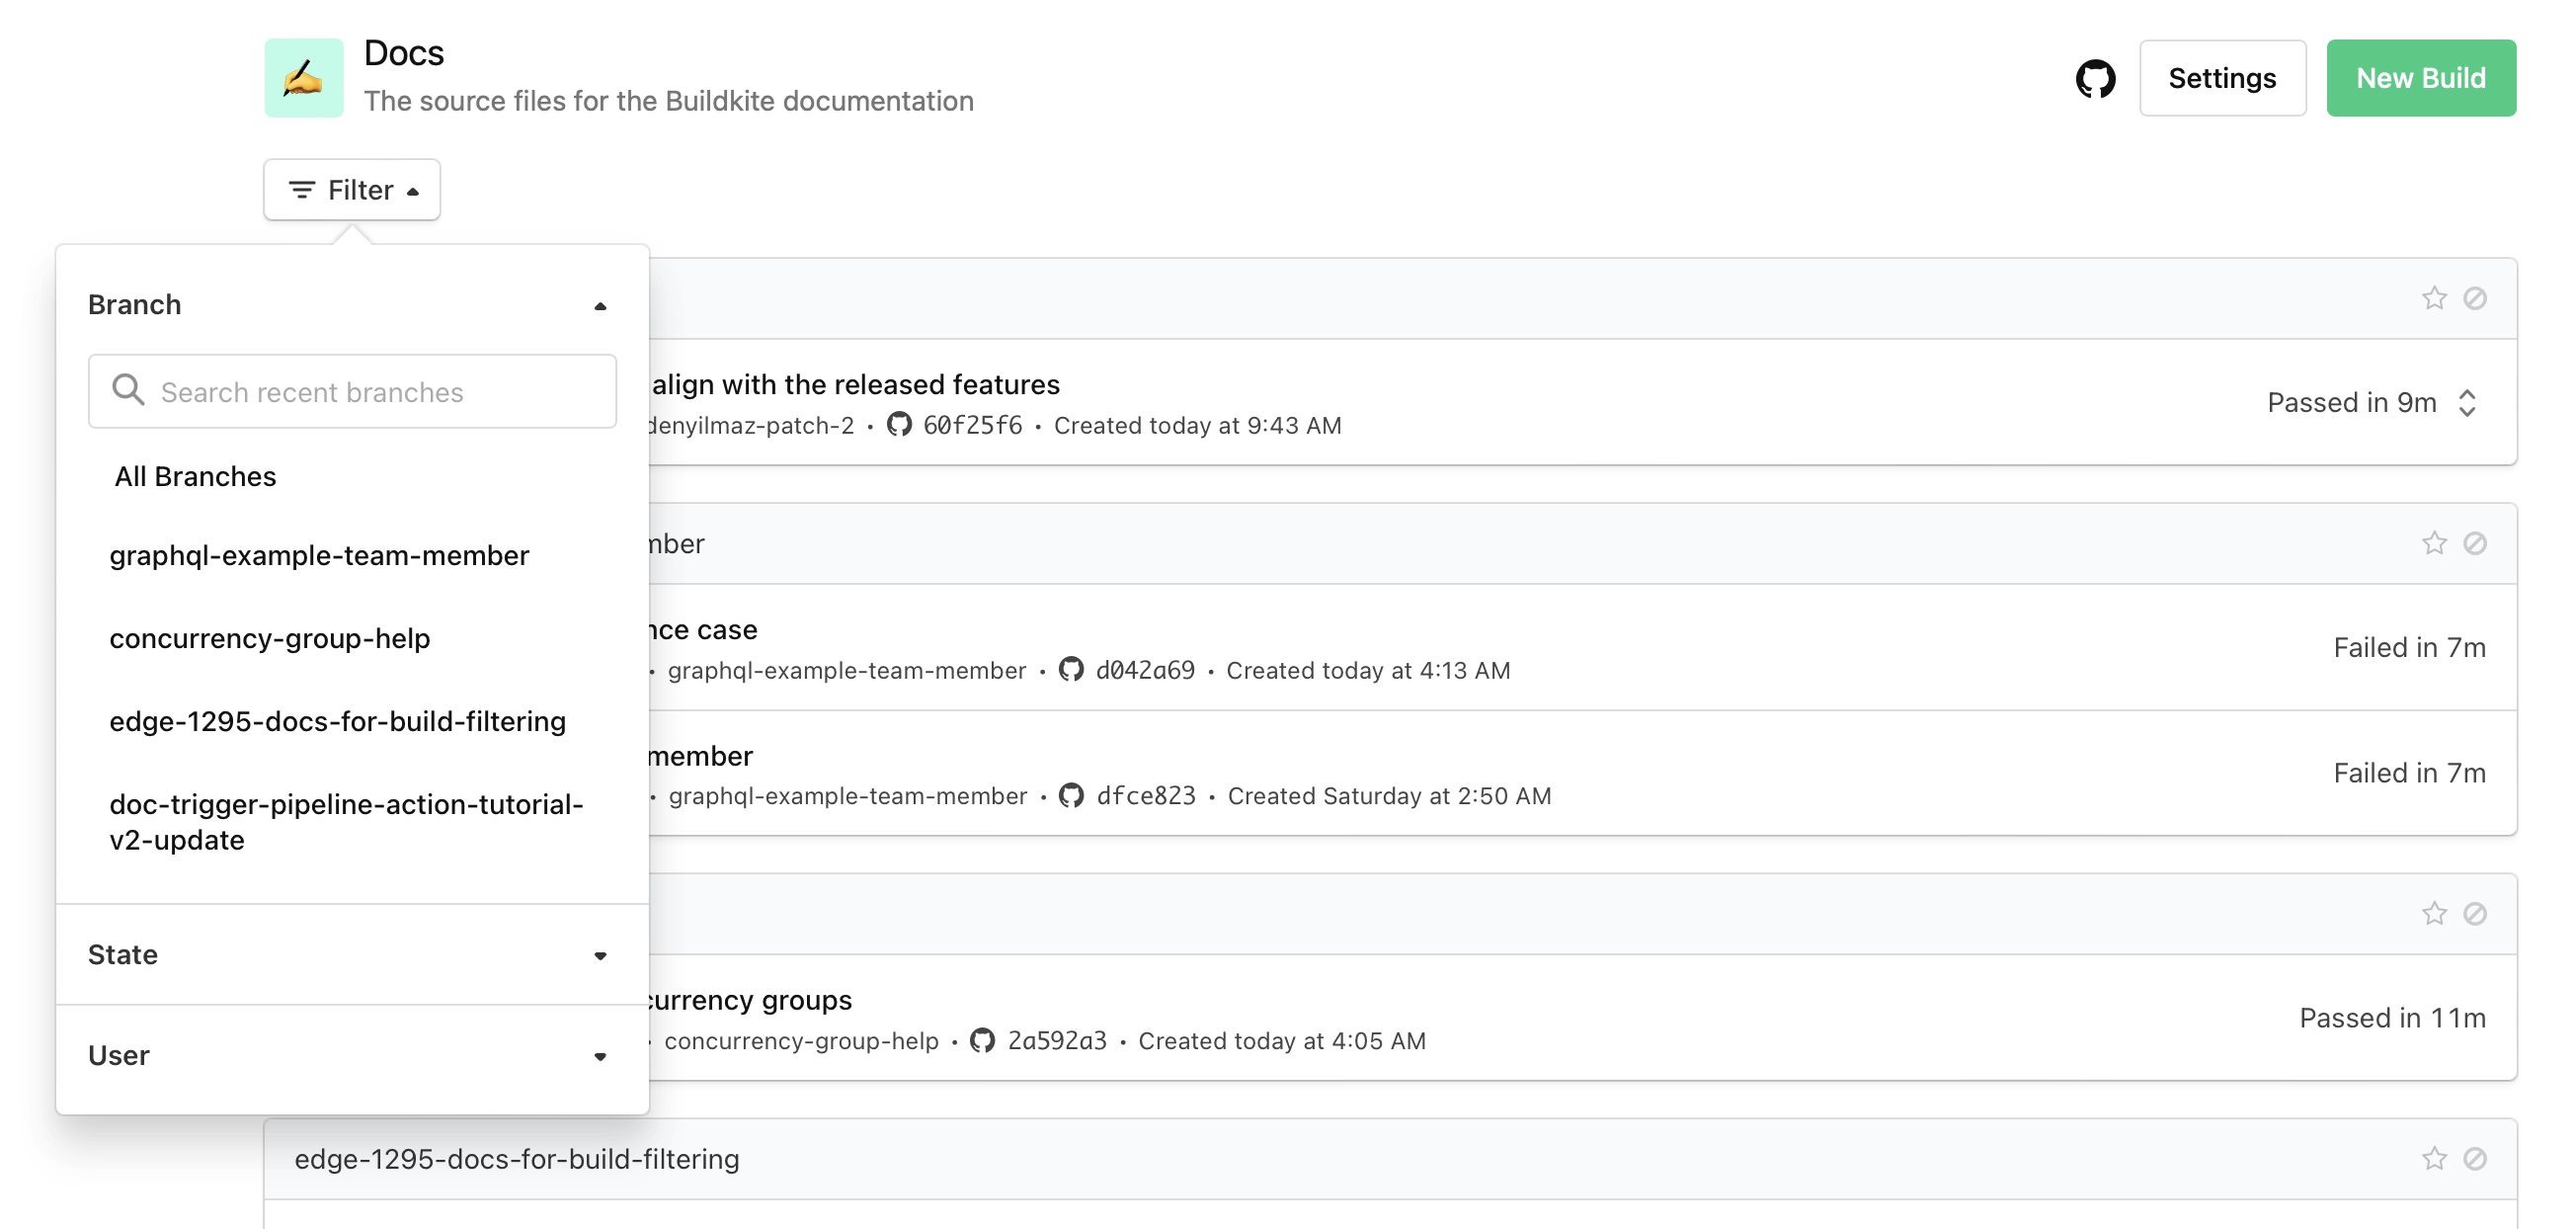
You can filter a pipeline’s builds by branch, build state, or your own builds using the Filter menu.
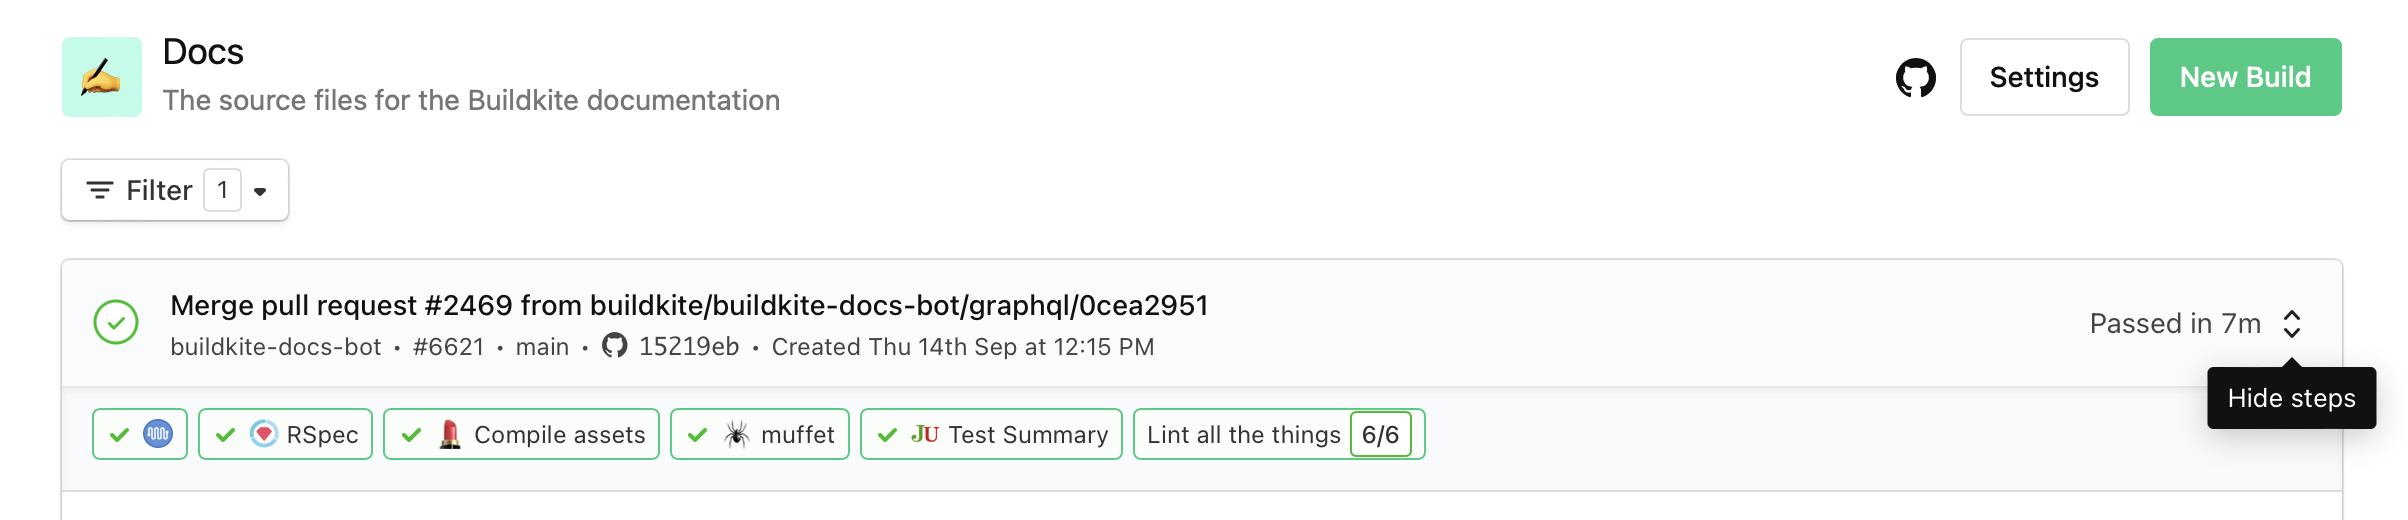
To see the steps for a build, select the Show steps button on the right of any build.
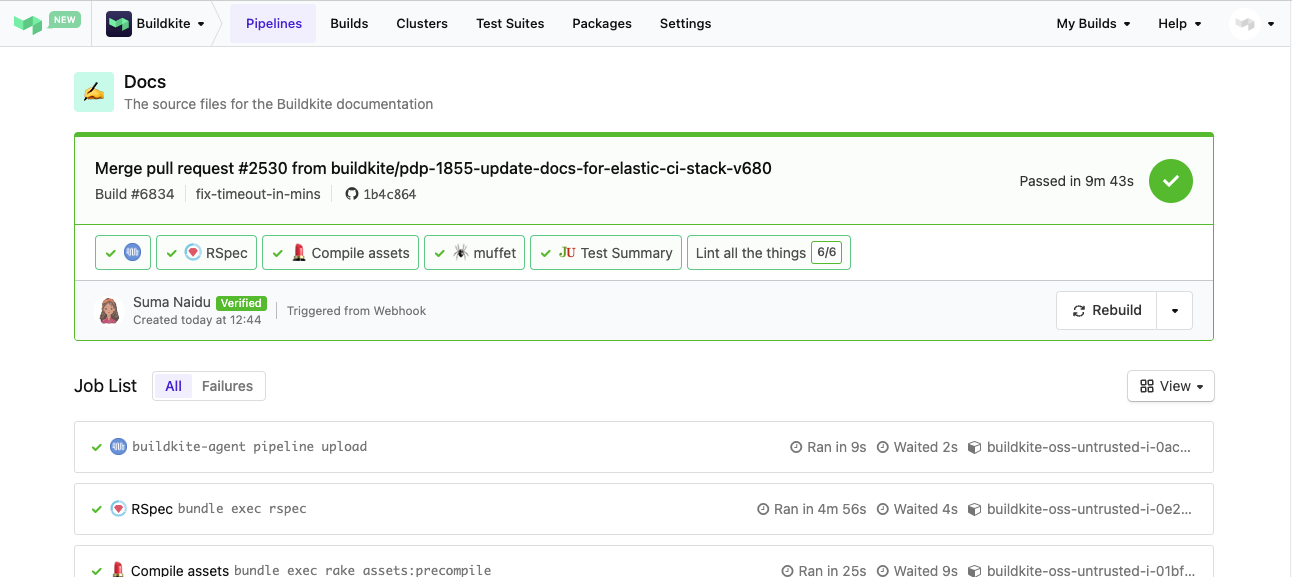
Build page
Select a build to view its page, which shows the full list of jobs and other steps in that build, the information about who triggered the build, and the controls for rebuilding or canceling the build while it's in progress.
Rebuilding a build
Selecting Rebuild creates a new build that copies the commit, branch, message, and environment variables from the original build.
A rebuild does not fetch anything new from the source control provider. Whatever was captured on the original build is replayed on the new one, including any environment variables set at the time and pull request data such as labels, draft state, and base branch. If any of that has changed in GitHub since the original build ran, the rebuild will not pick up the change.
To run a build against the current state of a pull request or branch, create a new build instead. Push a commit, enable the relevant GitHub webhook event triggers on the pipeline, or use the REST API with the values you want.
To retry all failed jobs for a build, select the dropdown menu next to the Rebuild button, and then select Retry failed jobs. This option will only appear in the dropdown menu when the build is finished, and there are eligible jobs to retry. Eligible jobs include command jobs in the failures tab, with the exception of those already waiting for automatic retries. If a pipeline build contains trigger steps, failed jobs in any of its triggered pipelines' builds are also included in the retry. Note that this does not apply to builds triggered by steps where the async attribute has been set to true.
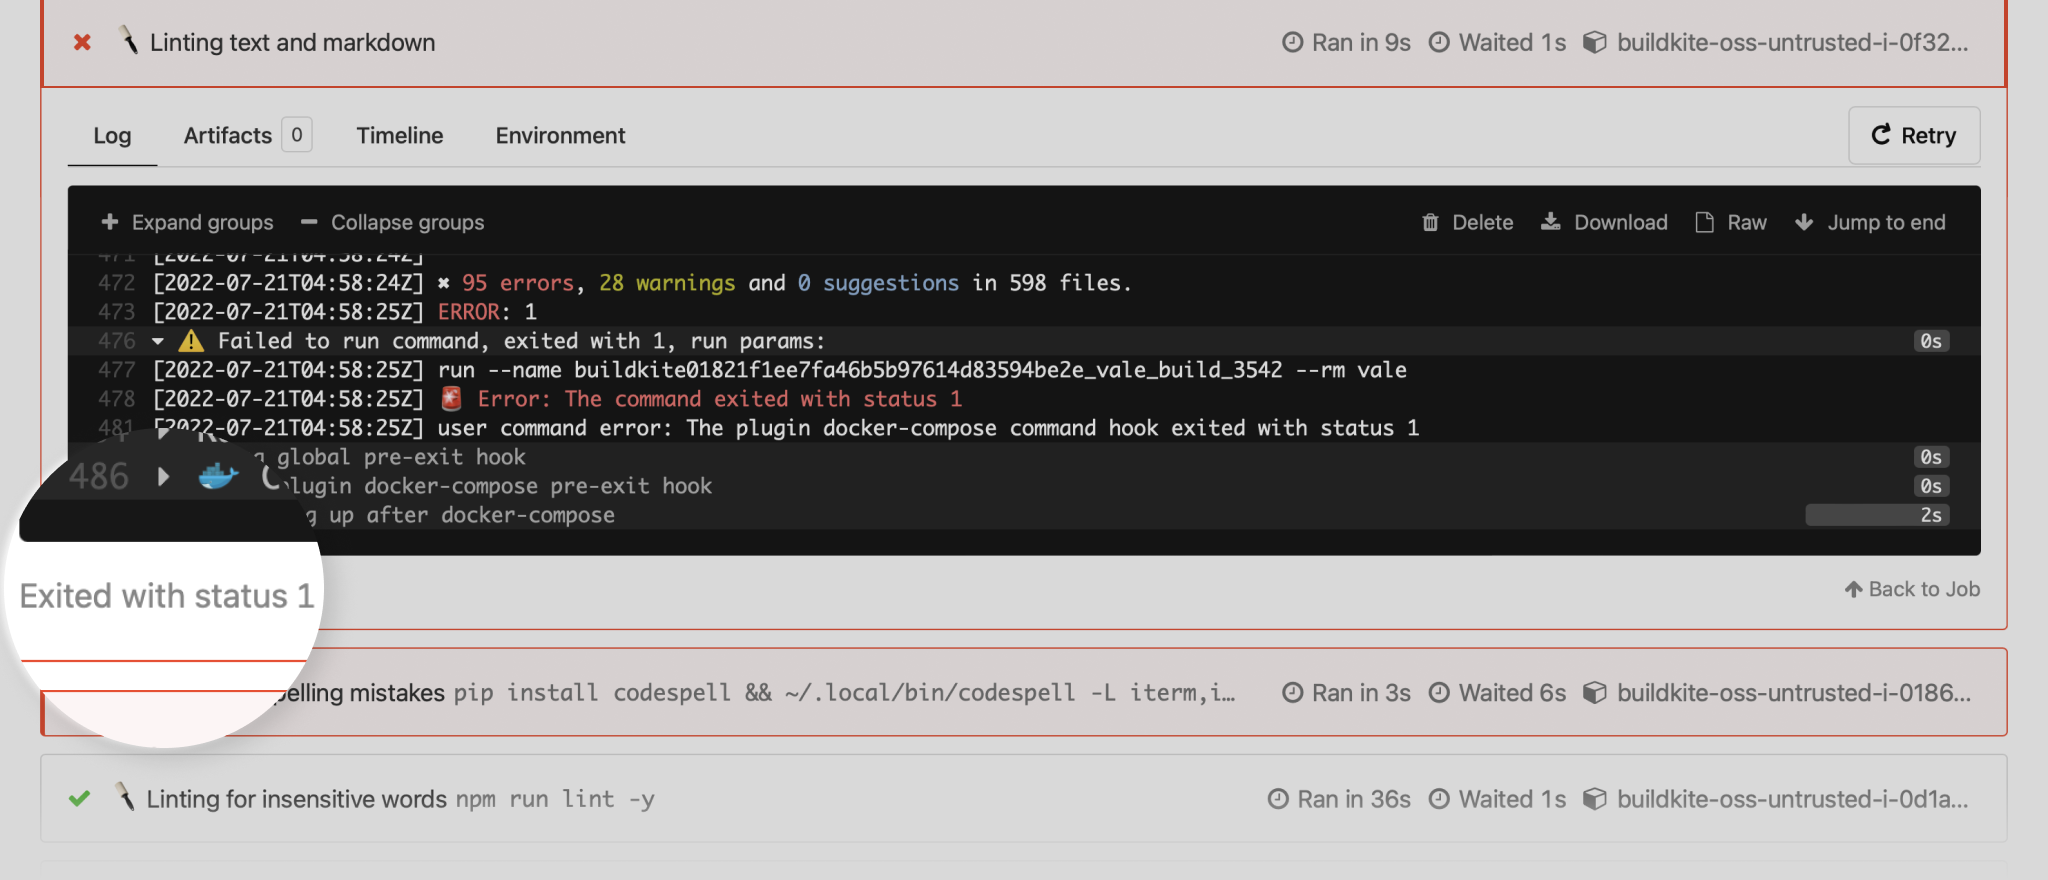
Each job in a build has a footer that displays the job exit status, which provides more visibility into the outcome of each job. It helps you to diagnose failed builds by finding issues with agents and pipelines.
Job exit status may include the exit signal reason, which indicates whether the Buildkite agent stopped or the job was canceled.
If you want to access the exit status through an API, it's only available in the GraphQL API.
Supported browsers
Buildkite Pipelines is designed with the latest web browsers in mind. For the sake of security and providing the best experience to most customers, we do not support browsers that are no longer receiving security updates and represent a small minority of traffic.
We support the latest two stable versions of the following desktop browsers:
Browsers not listed as supported or in beta or developer builds may not work as you expect, or at all. For the best experience, we recommend using the latest version of a supported browser.
All versions of Internet Explorer are not supported, and we recommend you migrate to a modern browser.
If you encounter any issues with Buildkite Pipelines on a supported browser, please contact us so we can improve its support.