Monitoring and observability
By default, the Buildkite agent is only observable either through Buildkite or through log output on the host. For help choosing between the different monitoring approaches available across Buildkite Pipelines, see the monitoring and observability decision matrix.
The default observability options are:
- Job logs: Relate to the jobs the agent runs. These are uploaded to Buildkite and shown for each step in a build.
- Agent logs: Relate to how the agent itself is running. These are not uploaded or saved (except where the output from the agent is read or redirected by another process, such as systemd or launchd).
Health checking, metrics, and status page
The agent can optionally run an HTTP service that describes the agent's state. The service is suitable for both automated health checks and human inspection.
You can enable the service with the --health-check-addr flag or
$BUILDKITE_AGENT_HEALTH_CHECK_ADDR environment variable. For example, to
enable the service listening on local port 3901, you can use:
buildkite-agent start --health-check-addr=:3901
The flag expects a "host:port" address.
Passing :0 allows the agent to choose a port, which will be logged at startup.
For security reasons, we recommend that you do not expose the service directly to the internet. While there should be no ability to manipulate the agent state using this service, it may expose information, or provide a vector for a denial-of-service attack. We may also add new features to the service in the future.
Health checking service routes
The URL paths available from the health checking service are as follows:
-
/: Returns HTTP status 200 with the textOK: Buildkite agent is running. -
/agent/(worker number): Reports the time since the agent worker last sent a successful heartbeat. Workers are numbered starting from 1, and the number of workers is set with the--spawnflag. If the previous heartbeat for this worker failed, it returns HTTP status 500 and a description of the failure. Otherwise, it returns HTTP status 200. -
/metrics: (Added in Buildkite agent version 3.113.0) Prometheus plain-text metrics describing agent behaviour over time. -
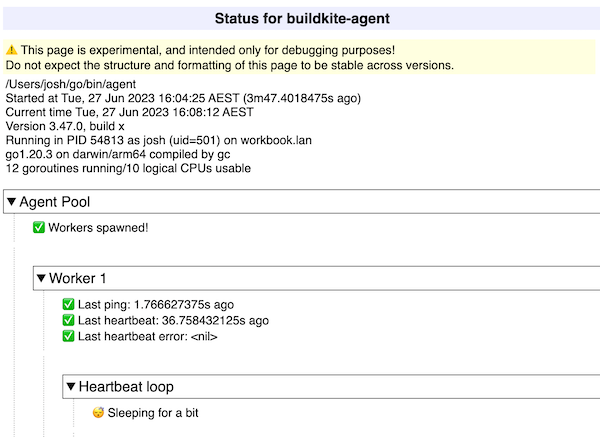
/status: A human-friendly page detailing various systems inside the agent. To aid debugging, this page does not automatically refresh—it shows the status of each internal component of the agent at a particular moment in time.
The following shows the /status page for an agent:
Prometheus metrics reference
Prometheus metrics were added to the health-checking service in Buildkite agent version 3.113.0.
| Metric | Type | Description |
|---|---|---|
buildkite_agent_jobs_ended_total |
Counter | Count of jobs that ended in any way for any reason |
buildkite_agent_jobs_started_total |
Counter | Count of jobs started |
buildkite_agent_logs_bytes_uploaded_total |
Counter | Count of log bytes uploaded |
buildkite_agent_logs_bytes_uploads_errored_total |
Counter | Count of log bytes that were not uploaded due to an error |
buildkite_agent_logs_chunk_uploads_errored_total |
Counter | Count of log chunks that were not uploaded due to an error |
buildkite_agent_logs_chunks_uploaded_total |
Counter | Count of log chunks uploaded |
buildkite_agent_logs_upload_duration_seconds_total |
Histogram | Time taken to upload log chunks |
buildkite_agent_pings_actions_total |
Counter | Count of actions taken following a ping, by action
|
buildkite_agent_pings_duration_seconds_total |
Histogram | Time taken to ping (the API call, not including the subsequent action) |
buildkite_agent_pings_errors_total |
Counter | Count of pings that failed due to an error |
buildkite_agent_pings_sent_total |
Counter | Count of pings sent |
buildkite_agent_pings_wait_duration_seconds_total |
Histogram | Time spent waiting prior to each ping (ping interval plus jitter) |
buildkite_agent_workers_ended_total |
Counter | Count of agent workers (that is, the --spawn flag) that have stopped running |
buildkite_agent_workers_started_total |
Counter | Count of agent workers (that is, the --spawn flag) that have started running |
To send the Prometheus metrics to Datadog, configure the Datadog Agent's OpenMetrics integration to scrape the /metrics endpoint. For example, with the health check service listening on port 3901, you will need to add the following to your Datadog Agent's openmetrics.d/conf.yaml:
instances:
  - openmetrics_endpoint: "http://localhost:3901/metrics"
    namespace: "buildkite_agent"
    metrics:
      - "buildkite_agent_*"
A count of currently-running agent workers can be found by subtracting ended_total from started_total:
sum(buildkite_agent_workers_started_total - buildkite_agent_workers_ended_total)
Similarly, a count of currently-running jobs using the same method:
sum(buildkite_agent_jobs_started_total - buildkite_agent_jobs_ended_total)
As all counter and histogram metrics are cumulative, information such as job or log throughput can be found using functions such as rate:
# Throughput of jobs started over 5m interval
sum(rate(buildkite_agent_jobs_started_total[5m]))

# Throughput of log bytes uploaded over 5m interval
sum(rate(buildkite_agent_logs_bytes_uploaded_total[5m]))
Datadog metrics
The Buildkite agent supports sending job duration metrics directly to Datadog through DogStatsD. These metrics track job success counts and timing and are separate from the Prometheus metrics exposed on the /metrics endpoint. To send Prometheus metrics such as buildkite_agent_workers_started_total to Datadog, use the OpenMetrics integration approach described above.
To enable Datadog metrics, start the agent with the --metrics-datadog option or set metrics-datadog=true in the agent's configuration file. The agent sends metrics to a DogStatsD server, which is bundled with the Datadog Agent.
buildkite-agent start --metrics-datadog
Additional configuration options:
| Option | Description | ||
|---|---|---|---|
| Option | --metrics-datadog-host |
Description | The DogStatsD instance to send metrics to using UDP. Environment variable: BUILDKITE_METRICS_DATADOG_HOSTDefault: 127.0.0.1:8125
|
| Option | --metrics-datadog-distributions |
Description | Use Datadog Distributions for timing metrics. This is recommended when running multiple agents to prevent metrics from multiple agents from being rolled up and appearing to have the same value. Environment variable: BUILDKITE_METRICS_DATADOG_DISTRIBUTIONSDefault: false
|
Once enabled, the agent will generate the following metrics (duration measured in milliseconds):
buildkite.jobs.successbuildkite.jobs.duration.success.avgbuildkite.jobs.duration.success.maxbuildkite.jobs.duration.success.countbuildkite.jobs.duration.success.medianbuildkite.jobs.duration.success.95percentile
For organization-level queue and agent metrics in Datadog (such as scheduled jobs count, idle agents, and busy agent percentage), use the buildkite-agent-metrics CLI with the StatsD backend.
Buildkite agent metrics CLI
The buildkite-agent-metrics tool is a standalone command-line binary that collects agent and job metrics from the metrics endpoint of the Buildkite agent API and publishes these metrics to a monitoring and observability backend of your choice. This tool is particularly useful for enabling autoscaling based on queue depth and agent availability.
The tool supports the following backends:
- AWS CloudWatch (default)
- StatsD (including Datadog-compatible tagging)
- Prometheus
- Google Cloud Monitoring
- New Relic
- OpenTelemetry
Installing
Download the latest binary from GitHub Releases, or run it as a Docker container:
docker run --rm public.ecr.aws/buildkite/agent-metrics:latest \
  -token "$BUILDKITE_AGENT_TOKEN" \
  -interval 30s \
  -queue my-queue
You can also install from source using Go:
go install github.com/buildkite/buildkite-agent-metrics/v5@latest
Running
The tool requires an agent token, which could be the same one used when assigning the self-hosted agent to a queue, or another agent token configured within the same cluster. The simplest deployment runs it as a long-running daemon that collects metrics across all queues in an organization:
buildkite-agent-metrics -token "$BUILDKITE_AGENT_TOKEN" -interval 30s
To restrict collection to specific queues, use the -queue flag (repeatable):
buildkite-agent-metrics -token "$BUILDKITE_AGENT_TOKEN" -interval 30s -queue my-queue
To select a backend, use the -backend flag:
buildkite-agent-metrics -token "$BUILDKITE_AGENT_TOKEN" -interval 30s -backend statsd
Collected metrics
The tool collects the following metrics per organization and per queue:
| Metric | Description | ||
|---|---|---|---|
| Metric |
|
Description |
Jobs waiting in the queue for an available agent. This should be close to zero if you have sufficient agent capacity. |
| Metric |
|
Description |
Jobs currently being executed by agents. |
| Metric |
|
Description |
Jobs that can't be scheduled yet due to dependencies or |
| Metric |
|
Description |
All jobs that have been scheduled but haven't finished. Includes both running and scheduled jobs. |
| Metric |
|
Description |
Agents connected but not running a job. |
| Metric |
|
Description |
Agents currently running a job. |
| Metric |
|
Description |
Total number of connected agents. |
| Metric |
|
Description |
Percentage of agents currently busy. |
Sending metrics to Datadog
To send organization-level queue and agent metrics to Datadog, use the StatsD backend with the -statsd-tags flag. The metrics will be sent to a DogStatsD server (bundled with the Datadog Agent), which forwards them to Datadog with queue-level tagging:
buildkite-agent-metrics \
  -token "$BUILDKITE_AGENT_TOKEN" \
  -interval 30s \
  -backend statsd \
  -statsd-host "127.0.0.1:8125" \
  -statsd-tags
The -statsd-tags flag enables Datadog-compatible tagging, so metrics are tagged by queue rather than including the queue name in the metric name. This allows you to filter and group metrics by queue in Datadog dashboards.
The Datadog Agent includes a DogStatsD server that listens on UDP port 8125 by default. Before starting the metrics collector, verify that the Datadog Agent is running and DogStatsD is enabled. For setup details, see the DogStatsD documentation.
For more details on configuration options, AWS Lambda deployment, and backend-specific settings, see the buildkite-agent-metrics README.
Tracing
For Datadog APM or OpenTelemetry tracing, see Tracing in the Buildkite agent.