Cluster insights
The cluster insights dashboard is only available on Enterprise plans.
The cluster insights dashboard provides real-time visibility into your build infrastructure's performance, helping you monitor and optimize your CI/CD workflows. This guide explains how to use and interpret the dashboard's metrics to improve your build system's efficiency.
To export metrics to external tools or compare cluster insights with other monitoring approaches, see the monitoring and observability best practices.
Before you start
The dashboard is available to all users of your Buildkite organization, but requires your build infrastructure to be managed through clusters. If you're using unclustered agents and want to access these insights, contact Buildkite support at support@buildkite.com to discuss migrating your workloads to clusters.
The shortcut to the cluster insights dashboard is https://buildkite.com/organizations/~/clusters/insights.
Access the cluster insights dashboard
To access the cluster insights dashboard:
- Select Agents in the global navigation to access the Clusters page.
- Select the View Cluster Insights button to access the cluster insights dashboard.
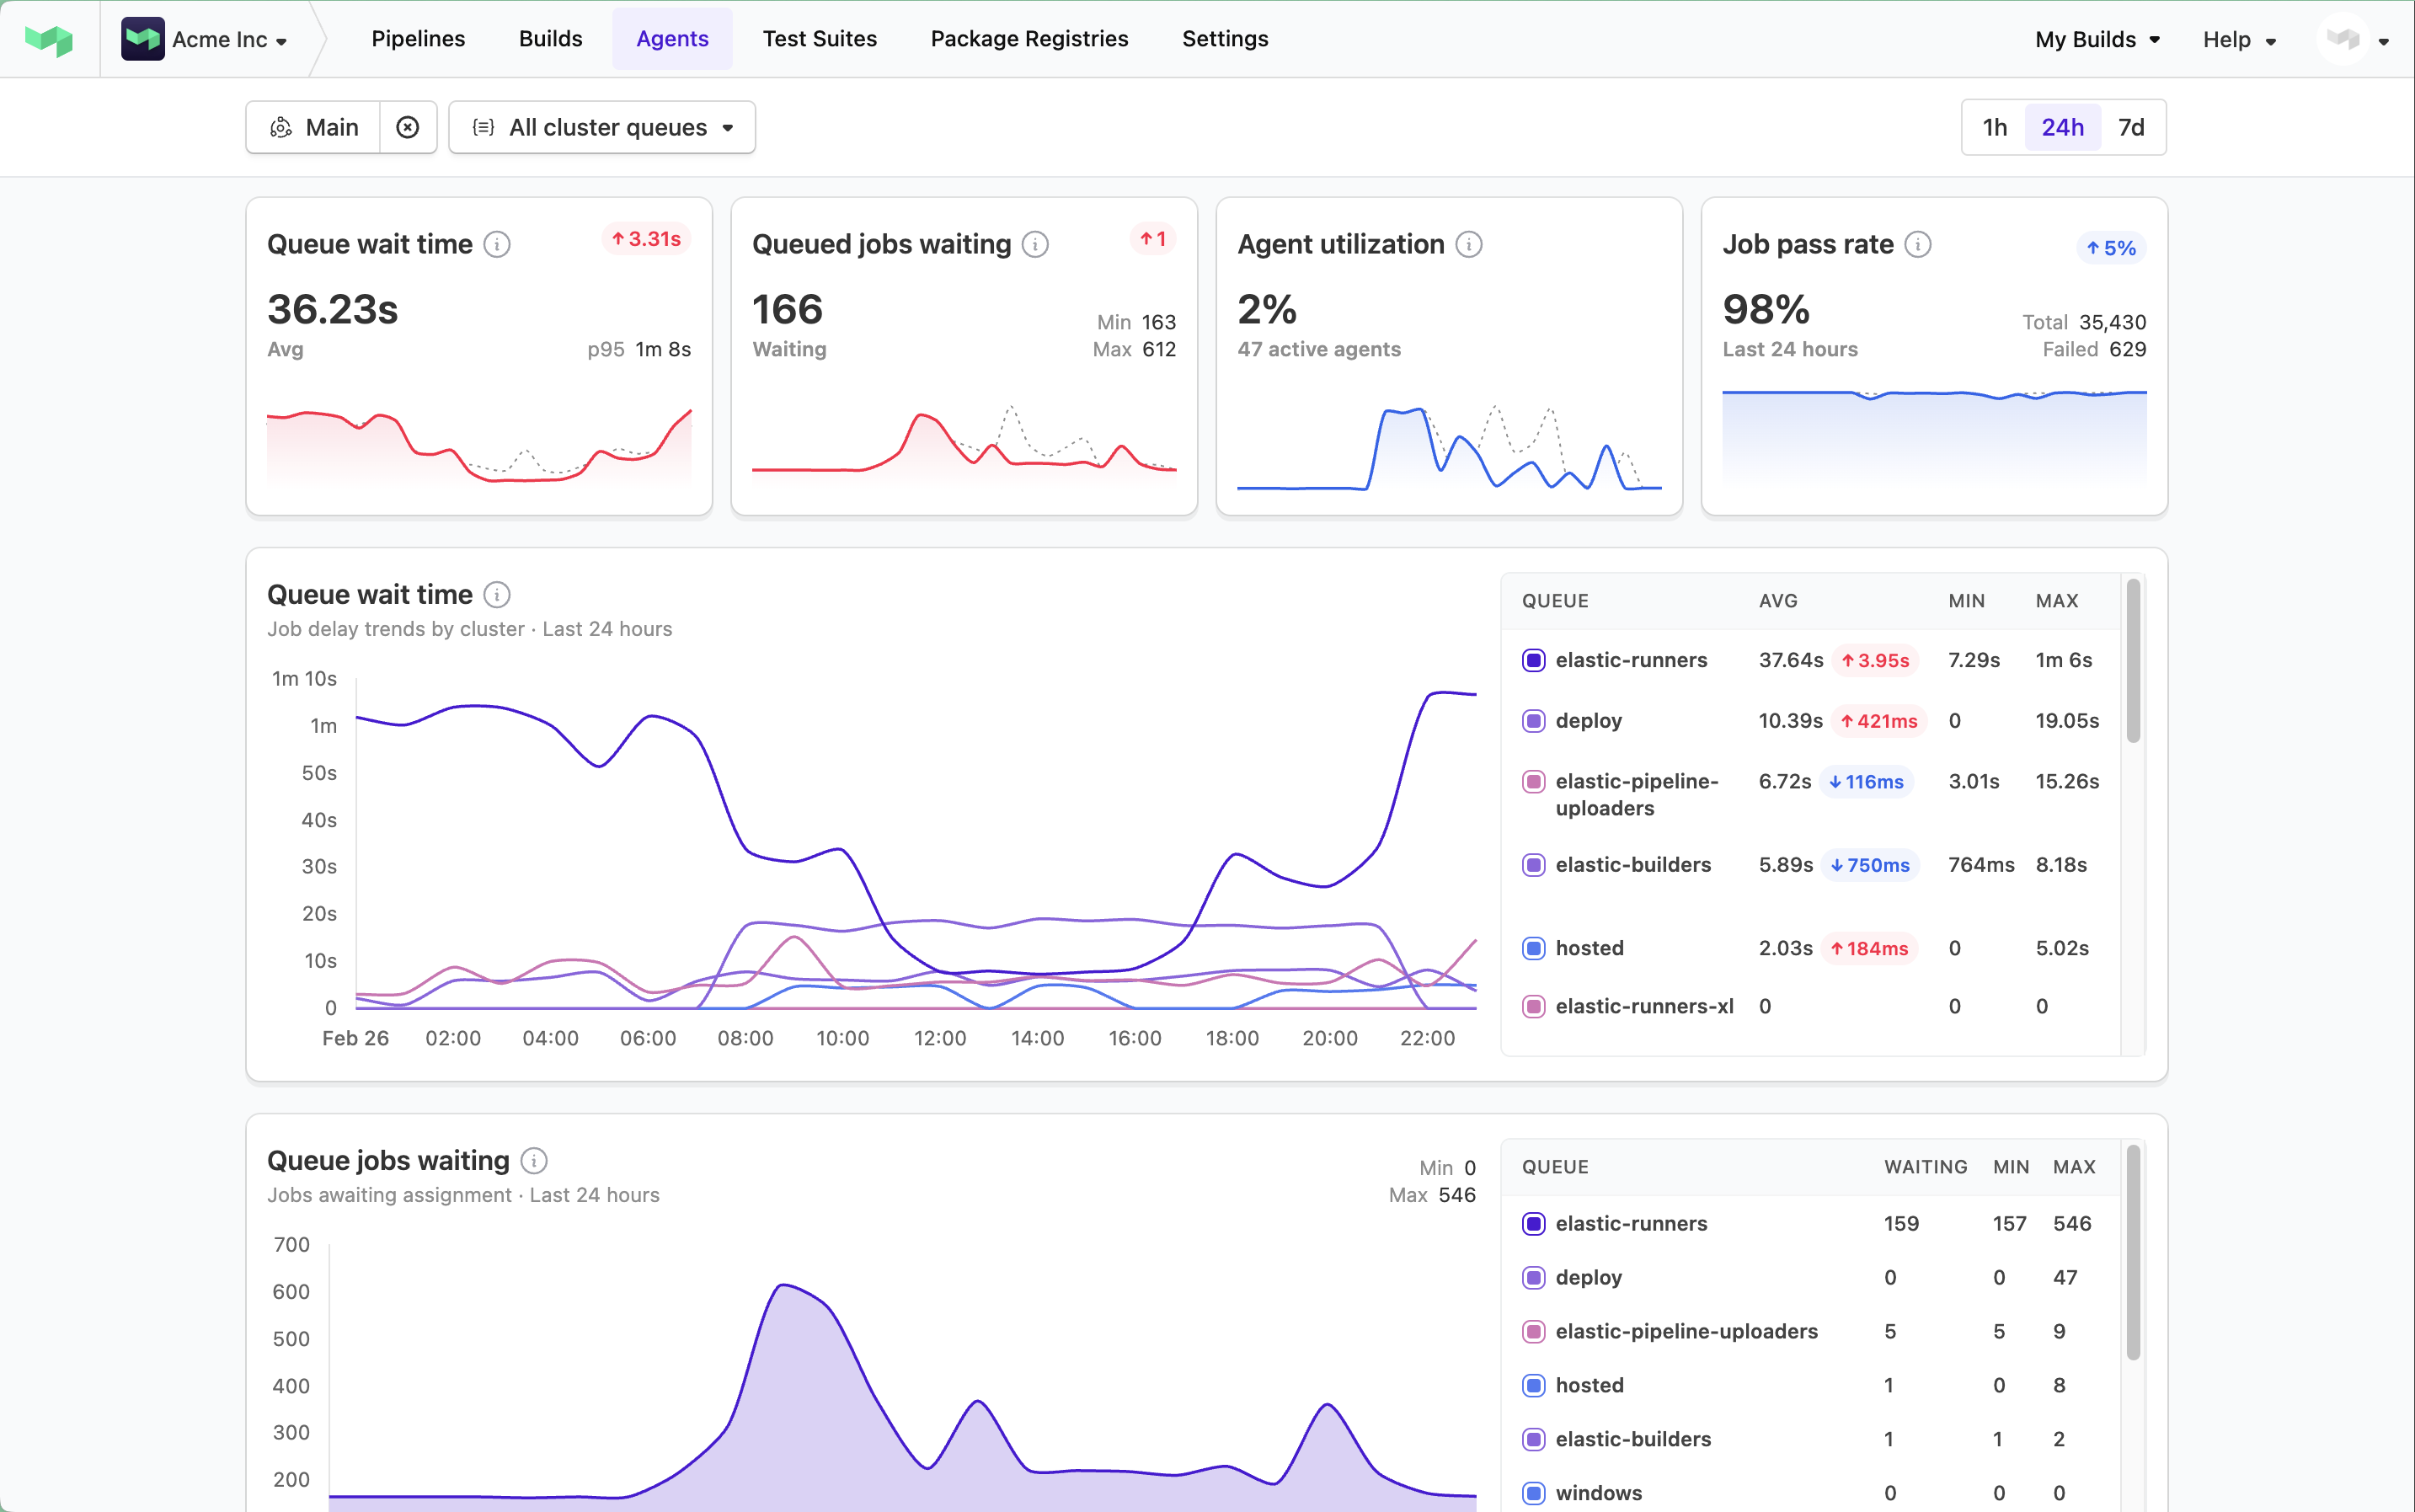
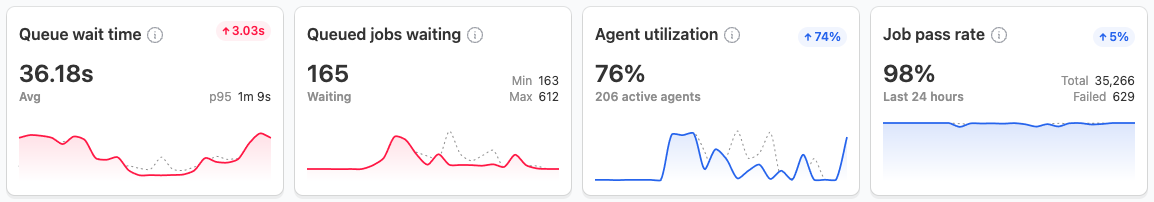
Dashboard overview
The cluster insights dashboard displays the following primary metrics that help you understand your CI system:
- queue wait time
- queued jobs waiting
- agent utilization
- job pass rate
Each metric provides specific insights into your build infrastructure's health and efficiency.
View different cluster and queue scopes
The cluster insights dashboard allows you to monitor your build infrastructure at different levels of detail.
By default, the dashboard shows metrics across all clusters within your Buildkite organization. However, you can use the following dropdowns to filter these metrics:
- All clusters — select a cluster to show only performance metrics associated with that cluster.
- All cluster queues — if a specific cluster is selected, select its queue to show only the statistics and metrics associated with that cluster's queue.
Time range analysis
The dashboard offers three time ranges for metric analysis. You can select between 1h (the default), 24h, or 7d to restrict the historical data shown to one hour, 24 hours, or seven days, respectively.
The one-hour default view helps with immediate issue investigation, while the 24-hour and seven-day views enable analysis of daily patterns and longer-term trends.
Understanding key metrics
Queue wait time
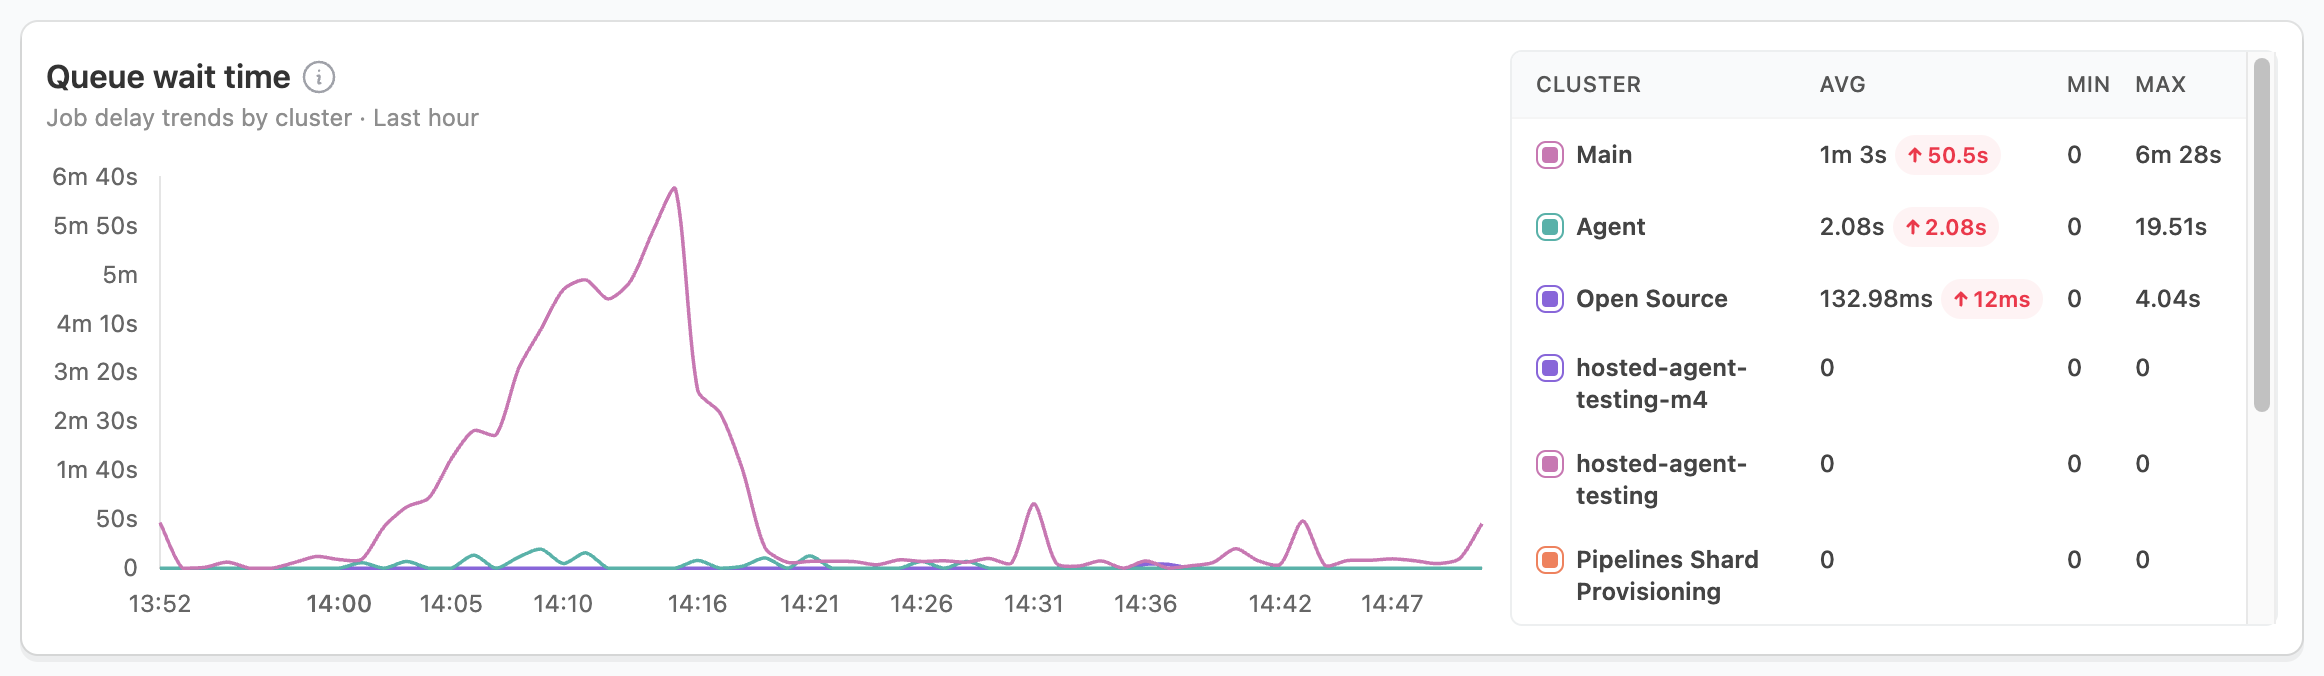
The queue wait time measures how long jobs wait before an agent starts processing them, directly impacting your build times and developer productivity. While brief spikes during high-activity periods are normal, especially as auto-scaling responds, sustained high wait times may indicate underlying issues.
When you notice sustained high wait times, investigate these areas:
- Check agent utilization rates.
- Review agent scaling configurations.
- Consider increasing your base agent count.
For recurring spikes, focus on:
- Analyzing peak usage patterns.
- Adjusting auto-scaling thresholds.
- Reviewing job scheduling strategies.
Queued jobs waiting
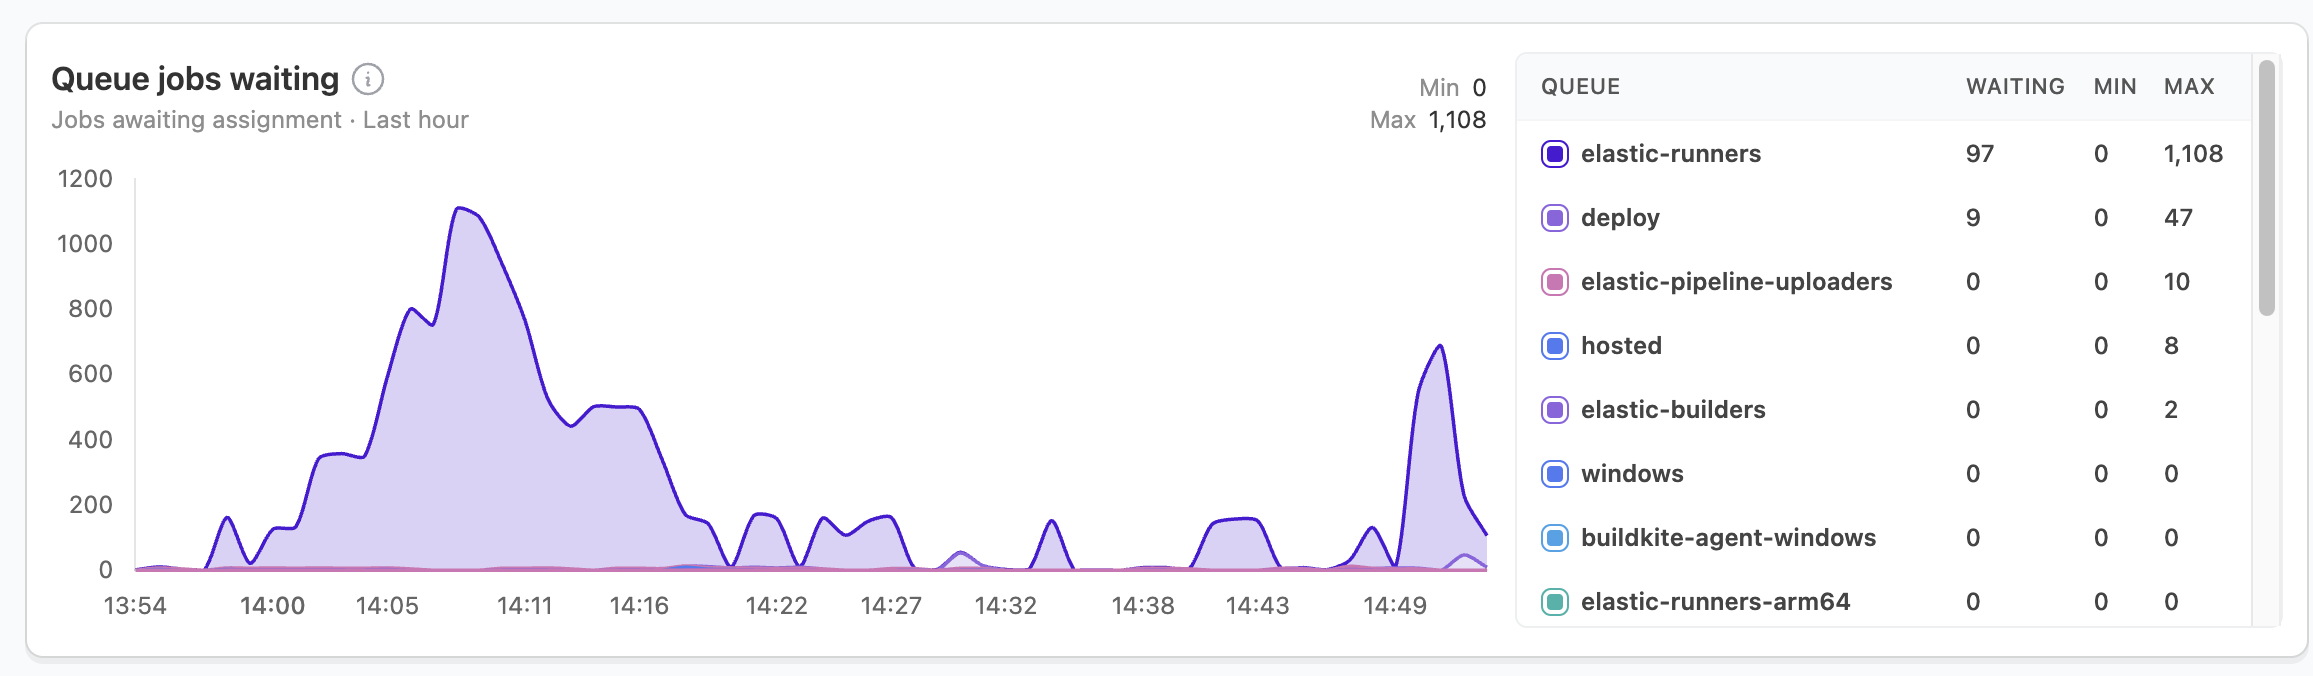
The queued jobs waiting metric shows the number of jobs awaiting assignment to an agent. It displays peak queue depth for your selected time period and volume trends by cluster. This metric provides critical insight into your build pipeline's throughput capacity.
When interpreting this metric:
- Brief spikes that resolve quickly are normal during high-activity periods and indicate your auto-scaling is working properly.
- Sustained spikes signal potential agent availability constraints that require attention.
For sustained high queue depths:
- Compare with agent utilization — High utilization with high queue depth indicates you need more agents.
- Check agent scaling configurations — Your scaling may be too slow or have insufficient maximum capacity.
- Review agent health — Agents may be online but unable to process jobs due to configuration issues.
- Analyze job distribution — Queue buildup might occur on specific queues while others remain idle.
For recurring patterns in queue depth:
- Identify peak usage times — Schedule non-urgent jobs outside these windows.
- Implement queue prioritization — Ensure critical jobs get processed first during high-demand periods.
- Adjust pre-scaling thresholds — Configure auto-scaling to anticipate known busy periods.
- Consider reserved capacity — Maintain a higher baseline agent count for predictable peak periods.
Effective queue management directly impacts developer productivity by reducing wait times and maintaining consistent build performance.
Agent utilization
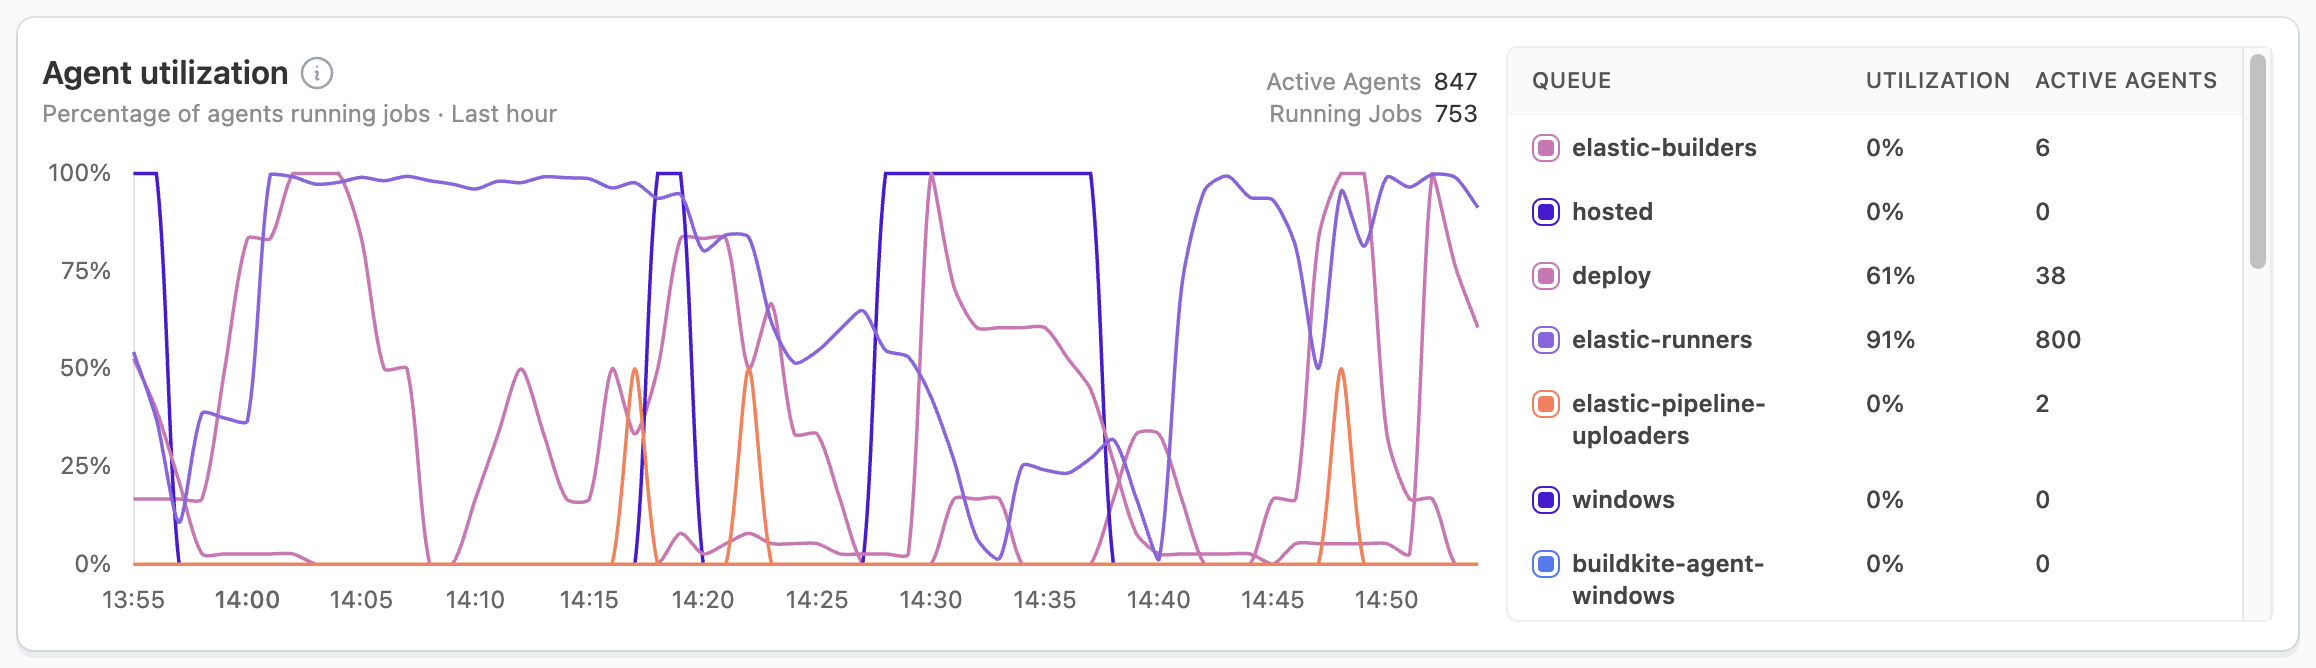
Agent utilization reveals the percentage of your agent fleet actively running jobs. Consistent utilization above 95% indicates potential capacity issues, and utilization below 70% suggests inefficient resource use.
When facing high utilization (>95%):
- Increase agent capacity.
- Review job distribution across clusters.
- Check for blocked or stalled agents.
For low utilization (<70%):
- Consider reducing agent capacity.
- Review agent scaling settings.
- Analyze job scheduling patterns.
Active agents and running jobs
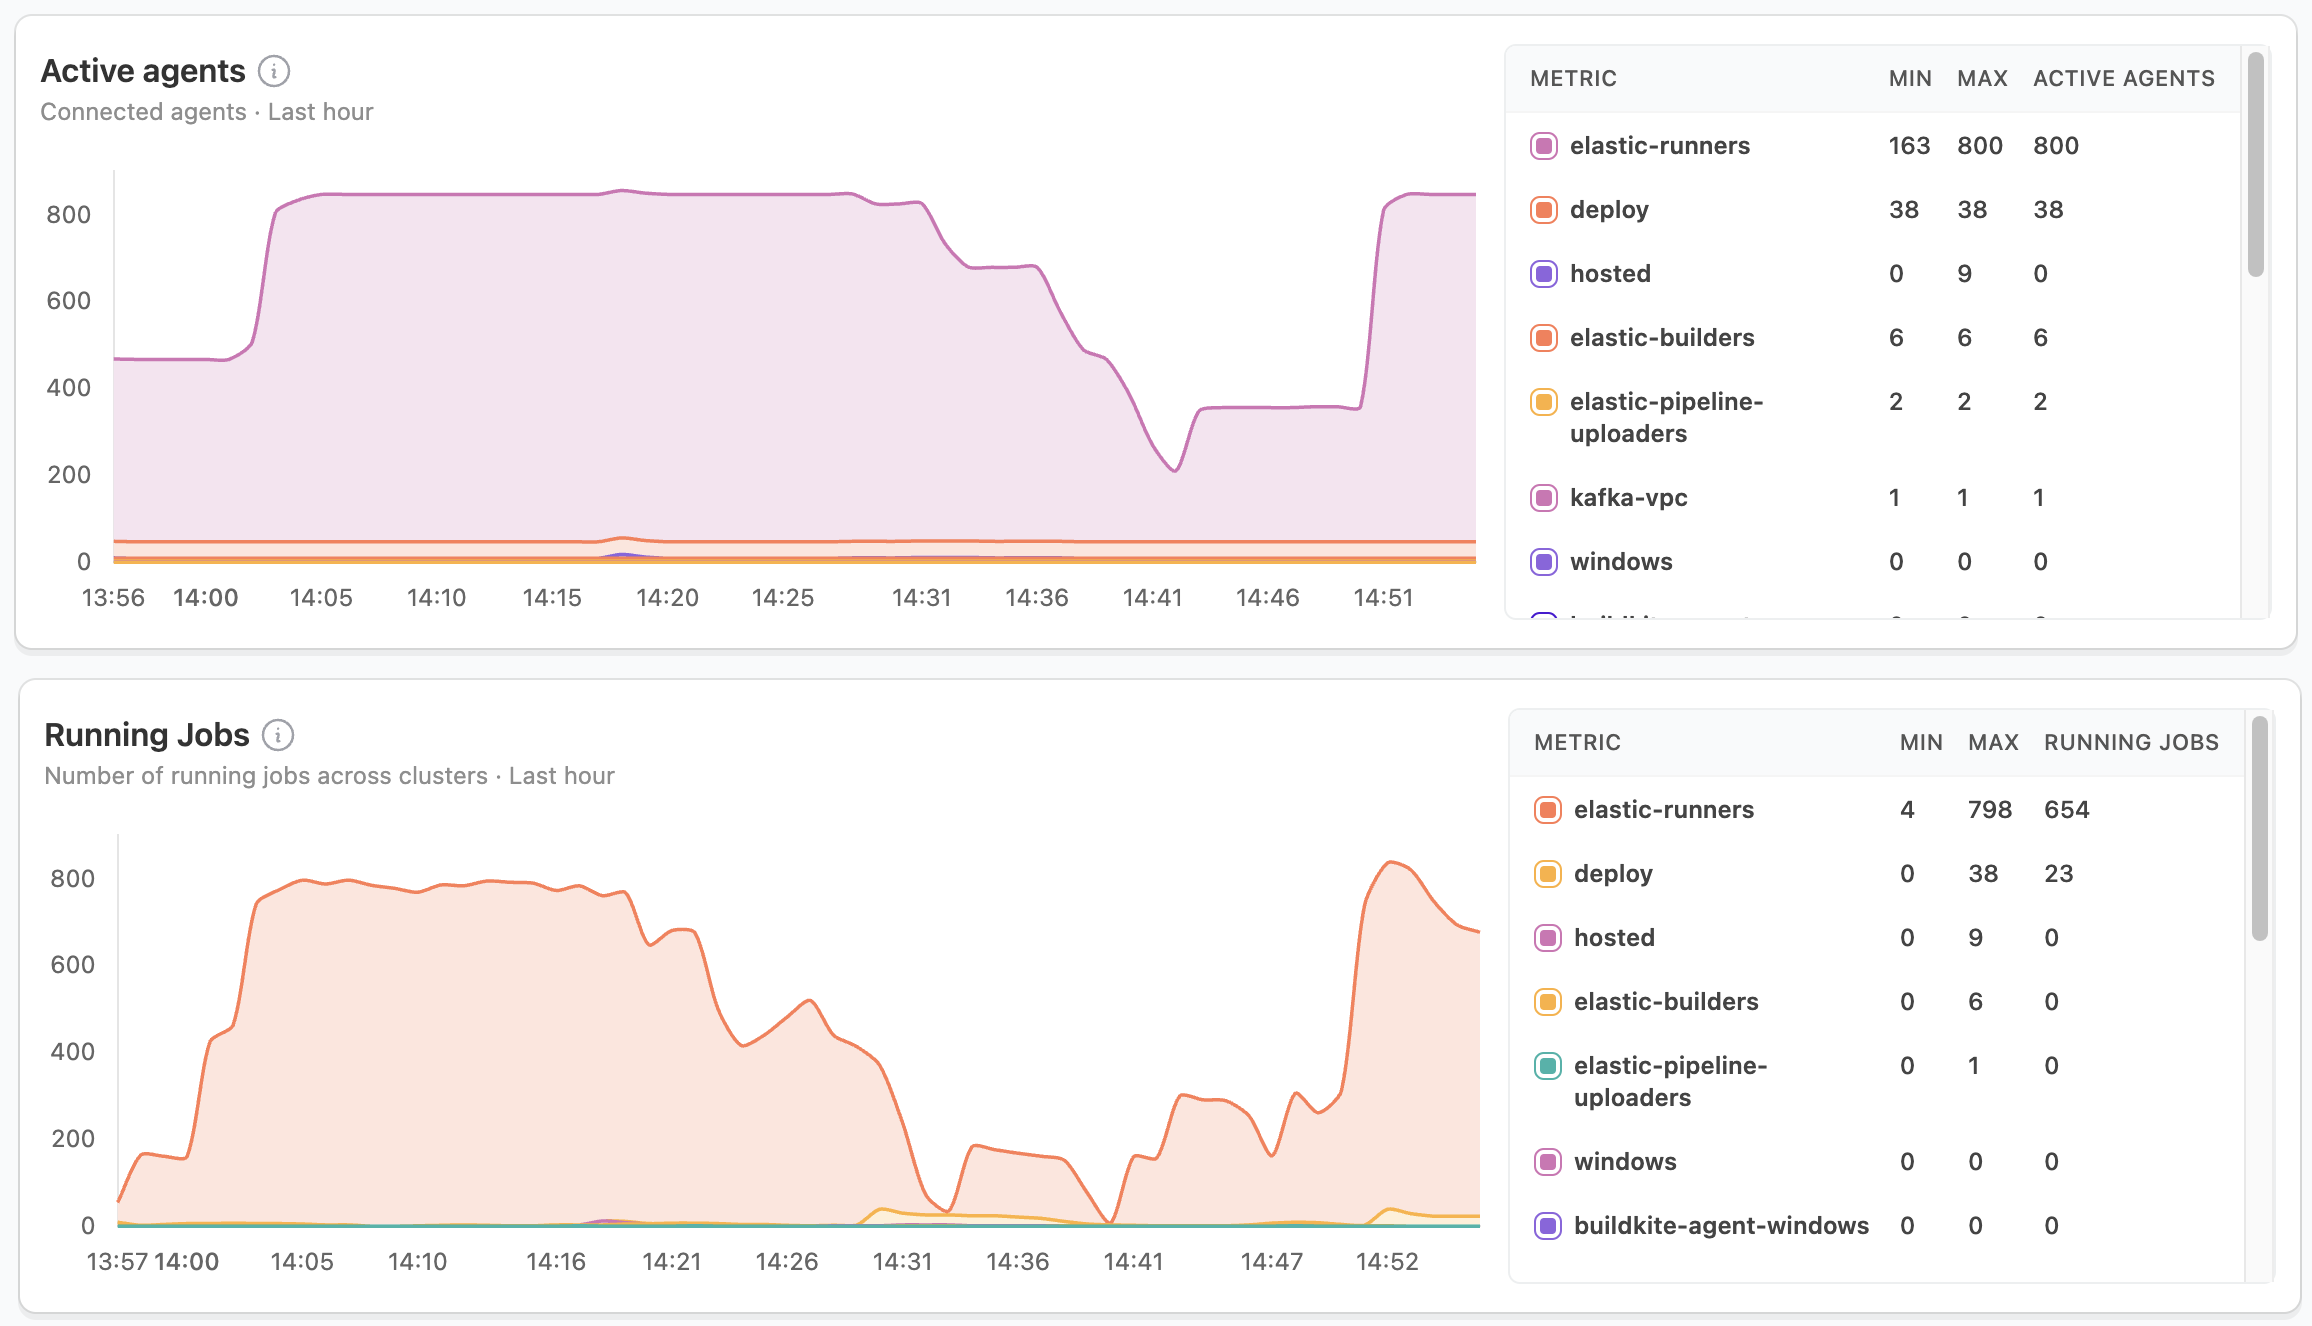
These metrics provide insight into your build capacity and resource usage. Sudden drops in active agents or misalignment between running jobs and agent utilization often indicate potential issues that need investigation.
When investigating capacity issues, consider:
- Monitor scaling effectiveness.
- Check agent health when seeing unexpected drops.
- Balance job distribution across clusters.
Job pass rate
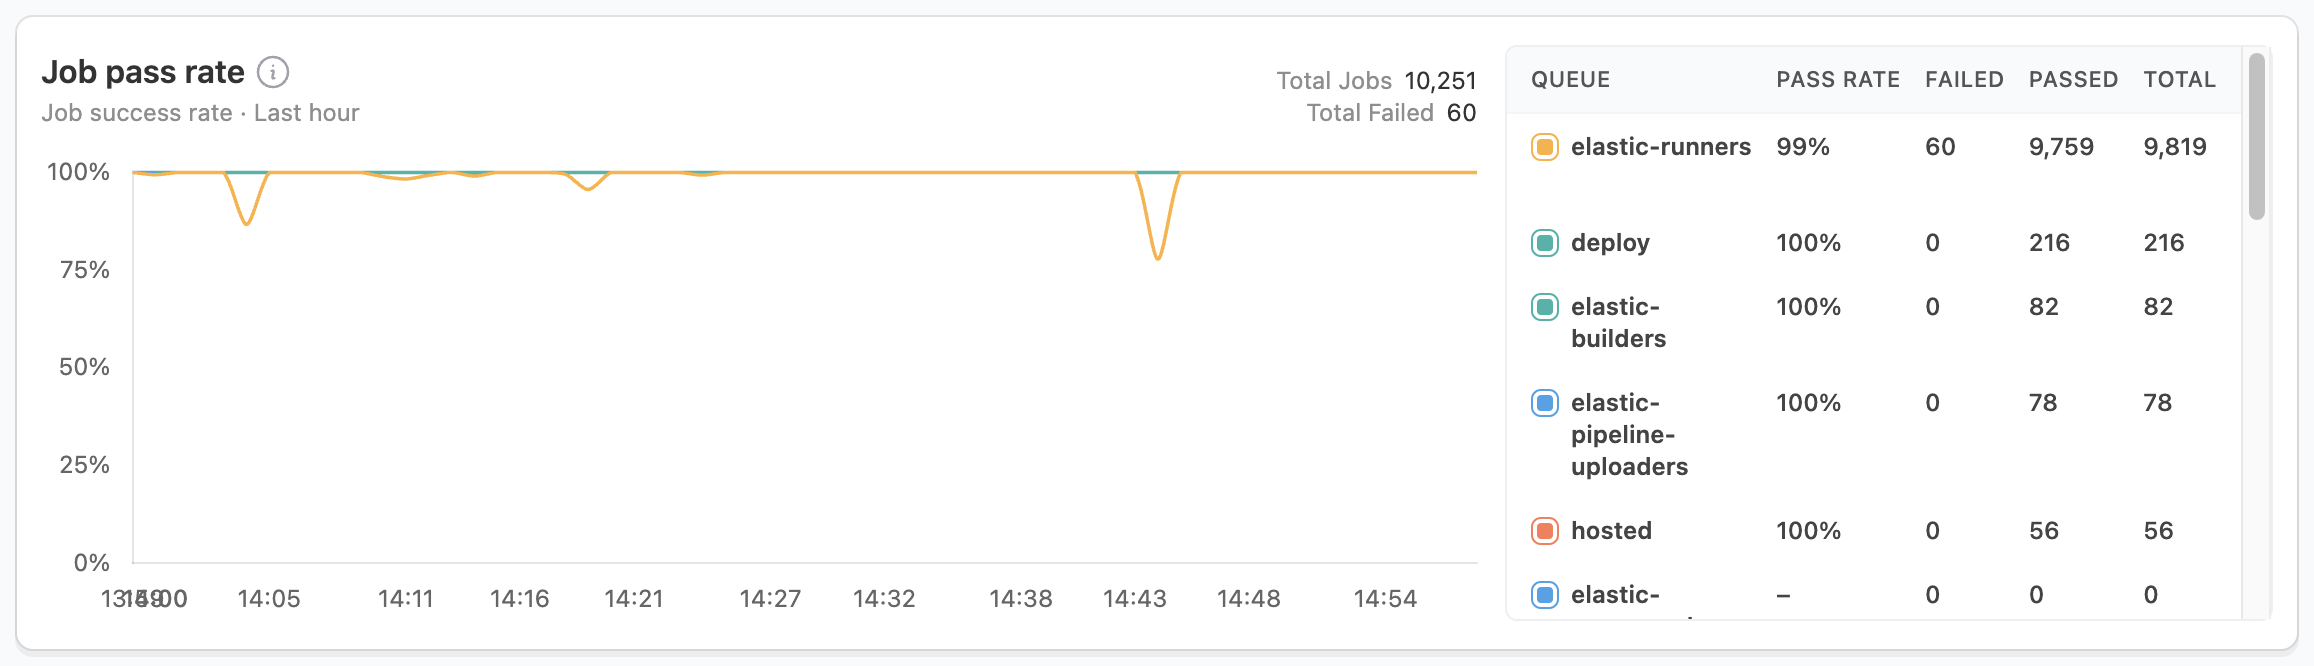
The job pass rate helps identify potential issues across your clusters. Sudden dips or sustained lower pass rates often indicate problems that require immediate attention.
For sudden dips in pass rate:
- Check affected clusters.
- Review recent changes.
- Investigate failed jobs.
When dealing with sustained lower pass rates:
- Analyze patterns by cluster.
- Review agent configurations.
- Check for infrastructure issues.
Common scenarios and solutions
High queue times with normal utilization
High queue times combined with normal utilization often point to inefficiencies in your build infrastructure. This pattern typically indicates agent capacity issues, job scheduling problems, or agent configuration mismatches.
To address these issues:
- Review agent scaling settings.
- Check job queue distribution.
- Analyze job resource requirements.
Spiky utilization patterns
Spiky utilization patterns usually stem from scheduled job bunching or insufficient auto-scaling response. These patterns can impact build performance and resource efficiency.
To optimize your setup:
- Adjust job scheduling.
- Review auto-scaling configurations.
- Consider workload distribution changes.
Getting help
The cluster insights dashboard helps identify potential issues, but sometimes you may need additional support. Buildkite offers several resources to help you optimize your build infrastructure:
- Review the Buildkite agents documentation.
- Contact Buildkite support at support@buildkite.com for personalized guidance.
- Join the Buildkite community forum to discuss configurations with other users.