
Test suites overview
In Test Engine, a test suite (or suite) is a collection of tests. A suite has a run, which is the execution of tests in a suite. A pipeline's build may create one or more of these runs.
Many organizations set up one suite per test framework, for example, one suite for RSpec, and another suite for Jest. Others use a common standard, such as JUnit XML, to combine tests from multiple frameworks to set up custom backend and frontend suites.
Each suite inside Test Engine has a unique API token that you can use to route test information to the correct suite. Pipelines and test suites do not need to have a one-to-one relationship.
Test suite API token versus user API access token
The test suite API token is only for uploading test results to the test suite. To perform other operations using the Test Engine REST API (such as listing suites, runs, or tests), use a Buildkite API access token for your user account with the appropriate scopes.
When creating a test suite for your development project, you'll need to have configured the appropriate test collectors for your project's test runners before your test suite can fully function and start collecting test data. Learn more about how to do this from the Test collection section of these docs.
To delete a suite, or regenerate its API token, go to suite settings.
Tests tab on build pages
Test Engine information is available on your test pipeline's build pages, in the new build view.
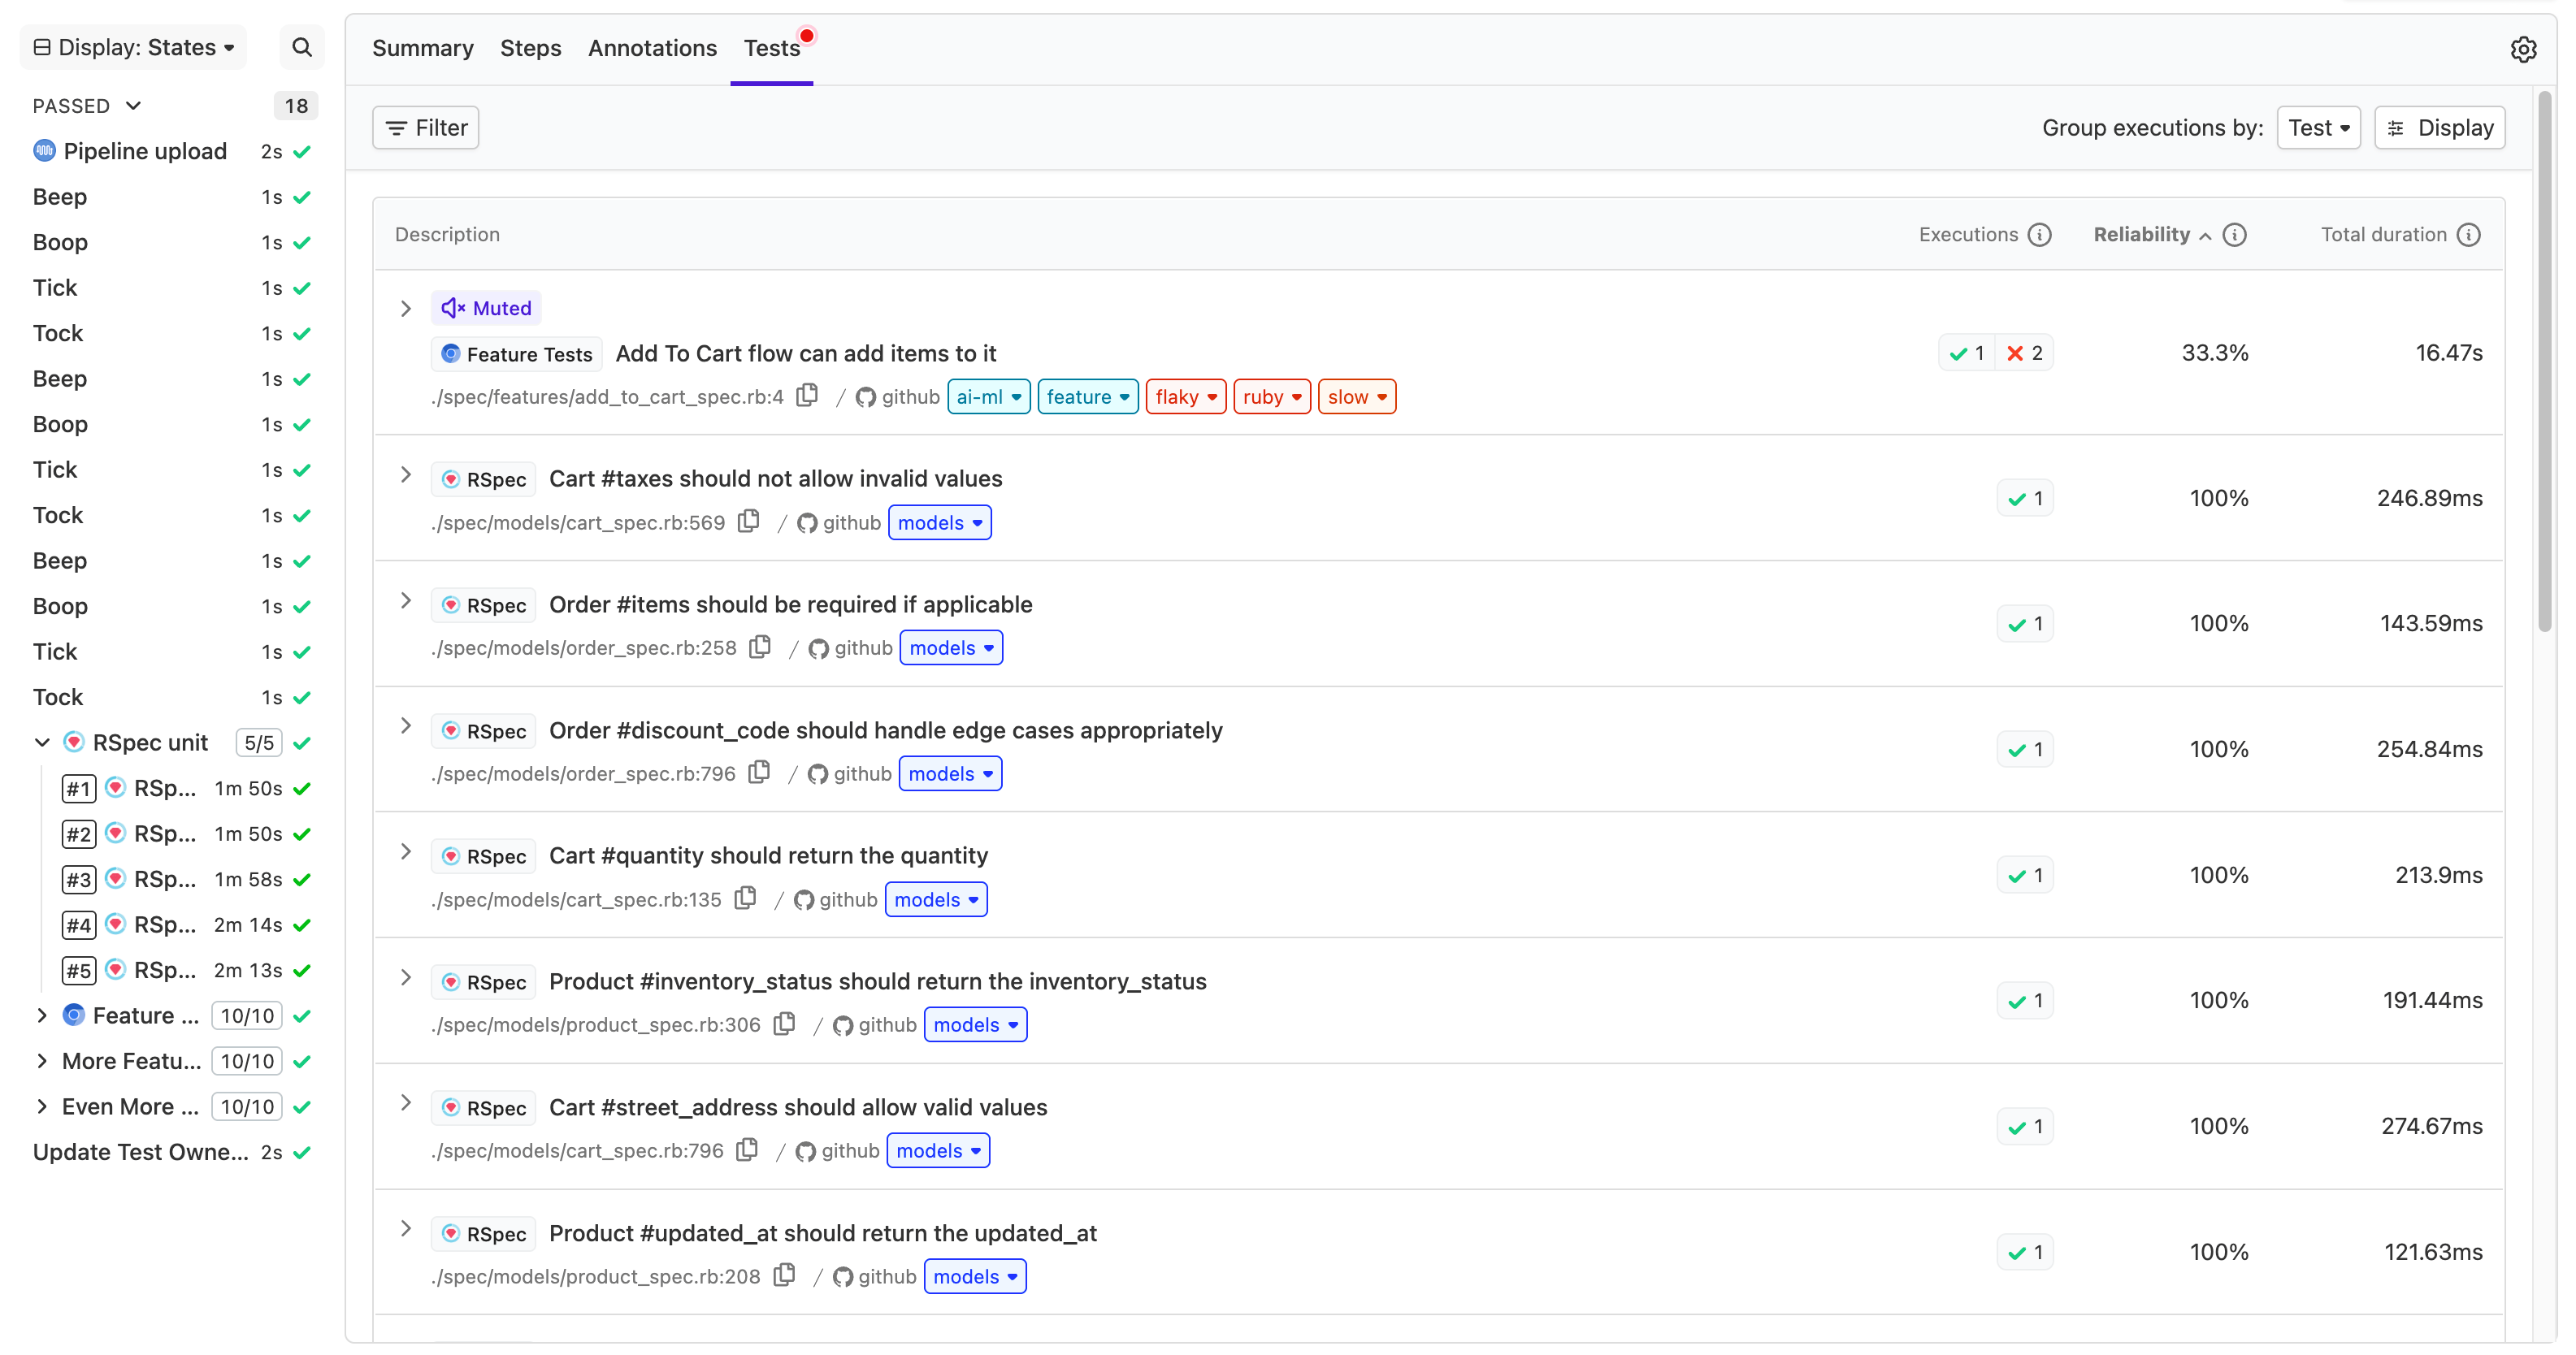
You can view the failing tests in a given build, and filter the test executions to analyze and surface trends about your test suite.
You can filter by result, state, owner, label, suite, and tag. Filtering by suite is useful when a build has tests from multiple suites (for example, RSpec and Jest), allowing you to focus on the results from specific suites.
You can also select Display to change the columns displayed on the Tests tab, so that other types of aggregate data (for example, average duration) appear. By default, the executions are grouped by test so that retried tests appear together.
When tests are grouped, select Expand failures to expand all failure reasons at once, or select Collapse failures to collapse them again.
The suite filter on the Tests tab supports two operators:
-
is: includes only the selected suite in the results -
is not: excludes the selected suite from the results
You can combine multiple suite filters to include or exclude several suites at once.
You can save your filter and display column selections as saved views directly from the Tests tab.
Parallelized builds
In CI/CD, a build's tests can be made to run in parallel using features of your own CI/CD pipeline or workflow tool. Parallelized pipeline/workflow builds typically run and complete faster than builds which are not parallelized.
In Buildkite Pipelines, you can run tests in parallel when they are configured as parallel jobs.
When tests are run in parallel across multiple agents, they can be grouped into the same run by defining the same run_env[key] environment variable. Learn more about this environment variable and others in CI environments.
The best way to coordinate the distribution of tests in a parallelized build is by implementing test splitting.
View by branch
All test suites have a default branch so you can track trends for your most important branch, and compare it to results across all branches. Organizations typically choose their main production branch as their default, although this is not required. All Test Engine views are filtered automatically to the default branch.
In addition to the default branch, you can add any number of additional stored branches. Stored branches accept prefix wildcard operators, and are useful for merge queues and other similar naming conventions. You can filter Test Engine views by a stored branch, or any branch, by using the branch filter.
To configure your branches, go to suite settings. In most cases, branch name is tracked automatically as part of the core tags Test Engine ingests on your behalf.
Tracking reliability
Test Engine calculates reliability of both your entire test suite and individual tests as a measure of pass/fail rate over time.
Reliability is defined as percentage calculated by:
- Test suite reliability =
passed_runs / (passed_runs + failed_runs) * 100 - Individual test reliability =
passed_test_executions / (passed_test_executions + failed_test_executions) * 100
Other test execution results such as unknown and skipped are ignored in the test reliability calculation.
In Test Engine, a run is marked as failed as soon as a test execution fails, regardless of whether it passes on a retry. This helps surface unreliable tests. You can have a situation where a build eventually passes on retry in a Pipeline, and the related run is marked as failed in Test Engine.
Upload summary
The Uploads view in a Buildkite Test Engine test suite shows a summary of test result uploads over time. Use it to track how frequently your suite receives uploads and to spot gaps or spikes in upload activity.
A period picker lets you switch between a one-day and a seven-day view. One day is the default. The seven-day view displays data in 84 two-hour buckets. If the maximum time window configured for Test Engine in your organization is shorter than seven days, the 7d option is shown as disabled and the view defaults to one day.
Test statistics
This feature is currently available in preview and must be enabled by Buildkite for your organization. Until it's enabled, the Summary page shows test statistics by team only, without the Group by dropdown. Contact Buildkite support to request access.
The Summary page of a test suite includes a Test statistics widget that breaks down test counts and execution duration. Use the Group by dropdown at the top of the widget to switch between Team (the default) and any available tag. The widget is shown by default, and users with Full Access to the suite can move or hide it. Learn more in Customize the Summary layout.
- Grouping by Team shows a row for each team assigned to the suite, based on test ownership. If your organization doesn't have teams or a TESTOWNERS file set up, Buildkite Test Engine shows a prompt to set up test ownership instead of the table.
- Grouping by tag doesn't require teams or test ownership to be configured. Search for a tag key in the Group by menu to group by its values.
Selecting a row takes you to the suite's Tests page, filtered to the tests behind that row. Missing or empty tag values are labeled No value and aren't clickable, along with any value that can't be expressed as an exact filter (for example, a value containing a comma, colon, or asterisk).
The Tests count in each row is the number of distinct tests. When grouped by tag, a test appears in more than one row if its executions have different values for the selected tag key. Because of this, the Tests counts across rows aren't guaranteed to add up to the suite total.
Tag values are listed in alphabetical order, 10 per page, with pagination controls below the table. The table respects the period and filters applied elsewhere on the Summary page.
Trends and analysis
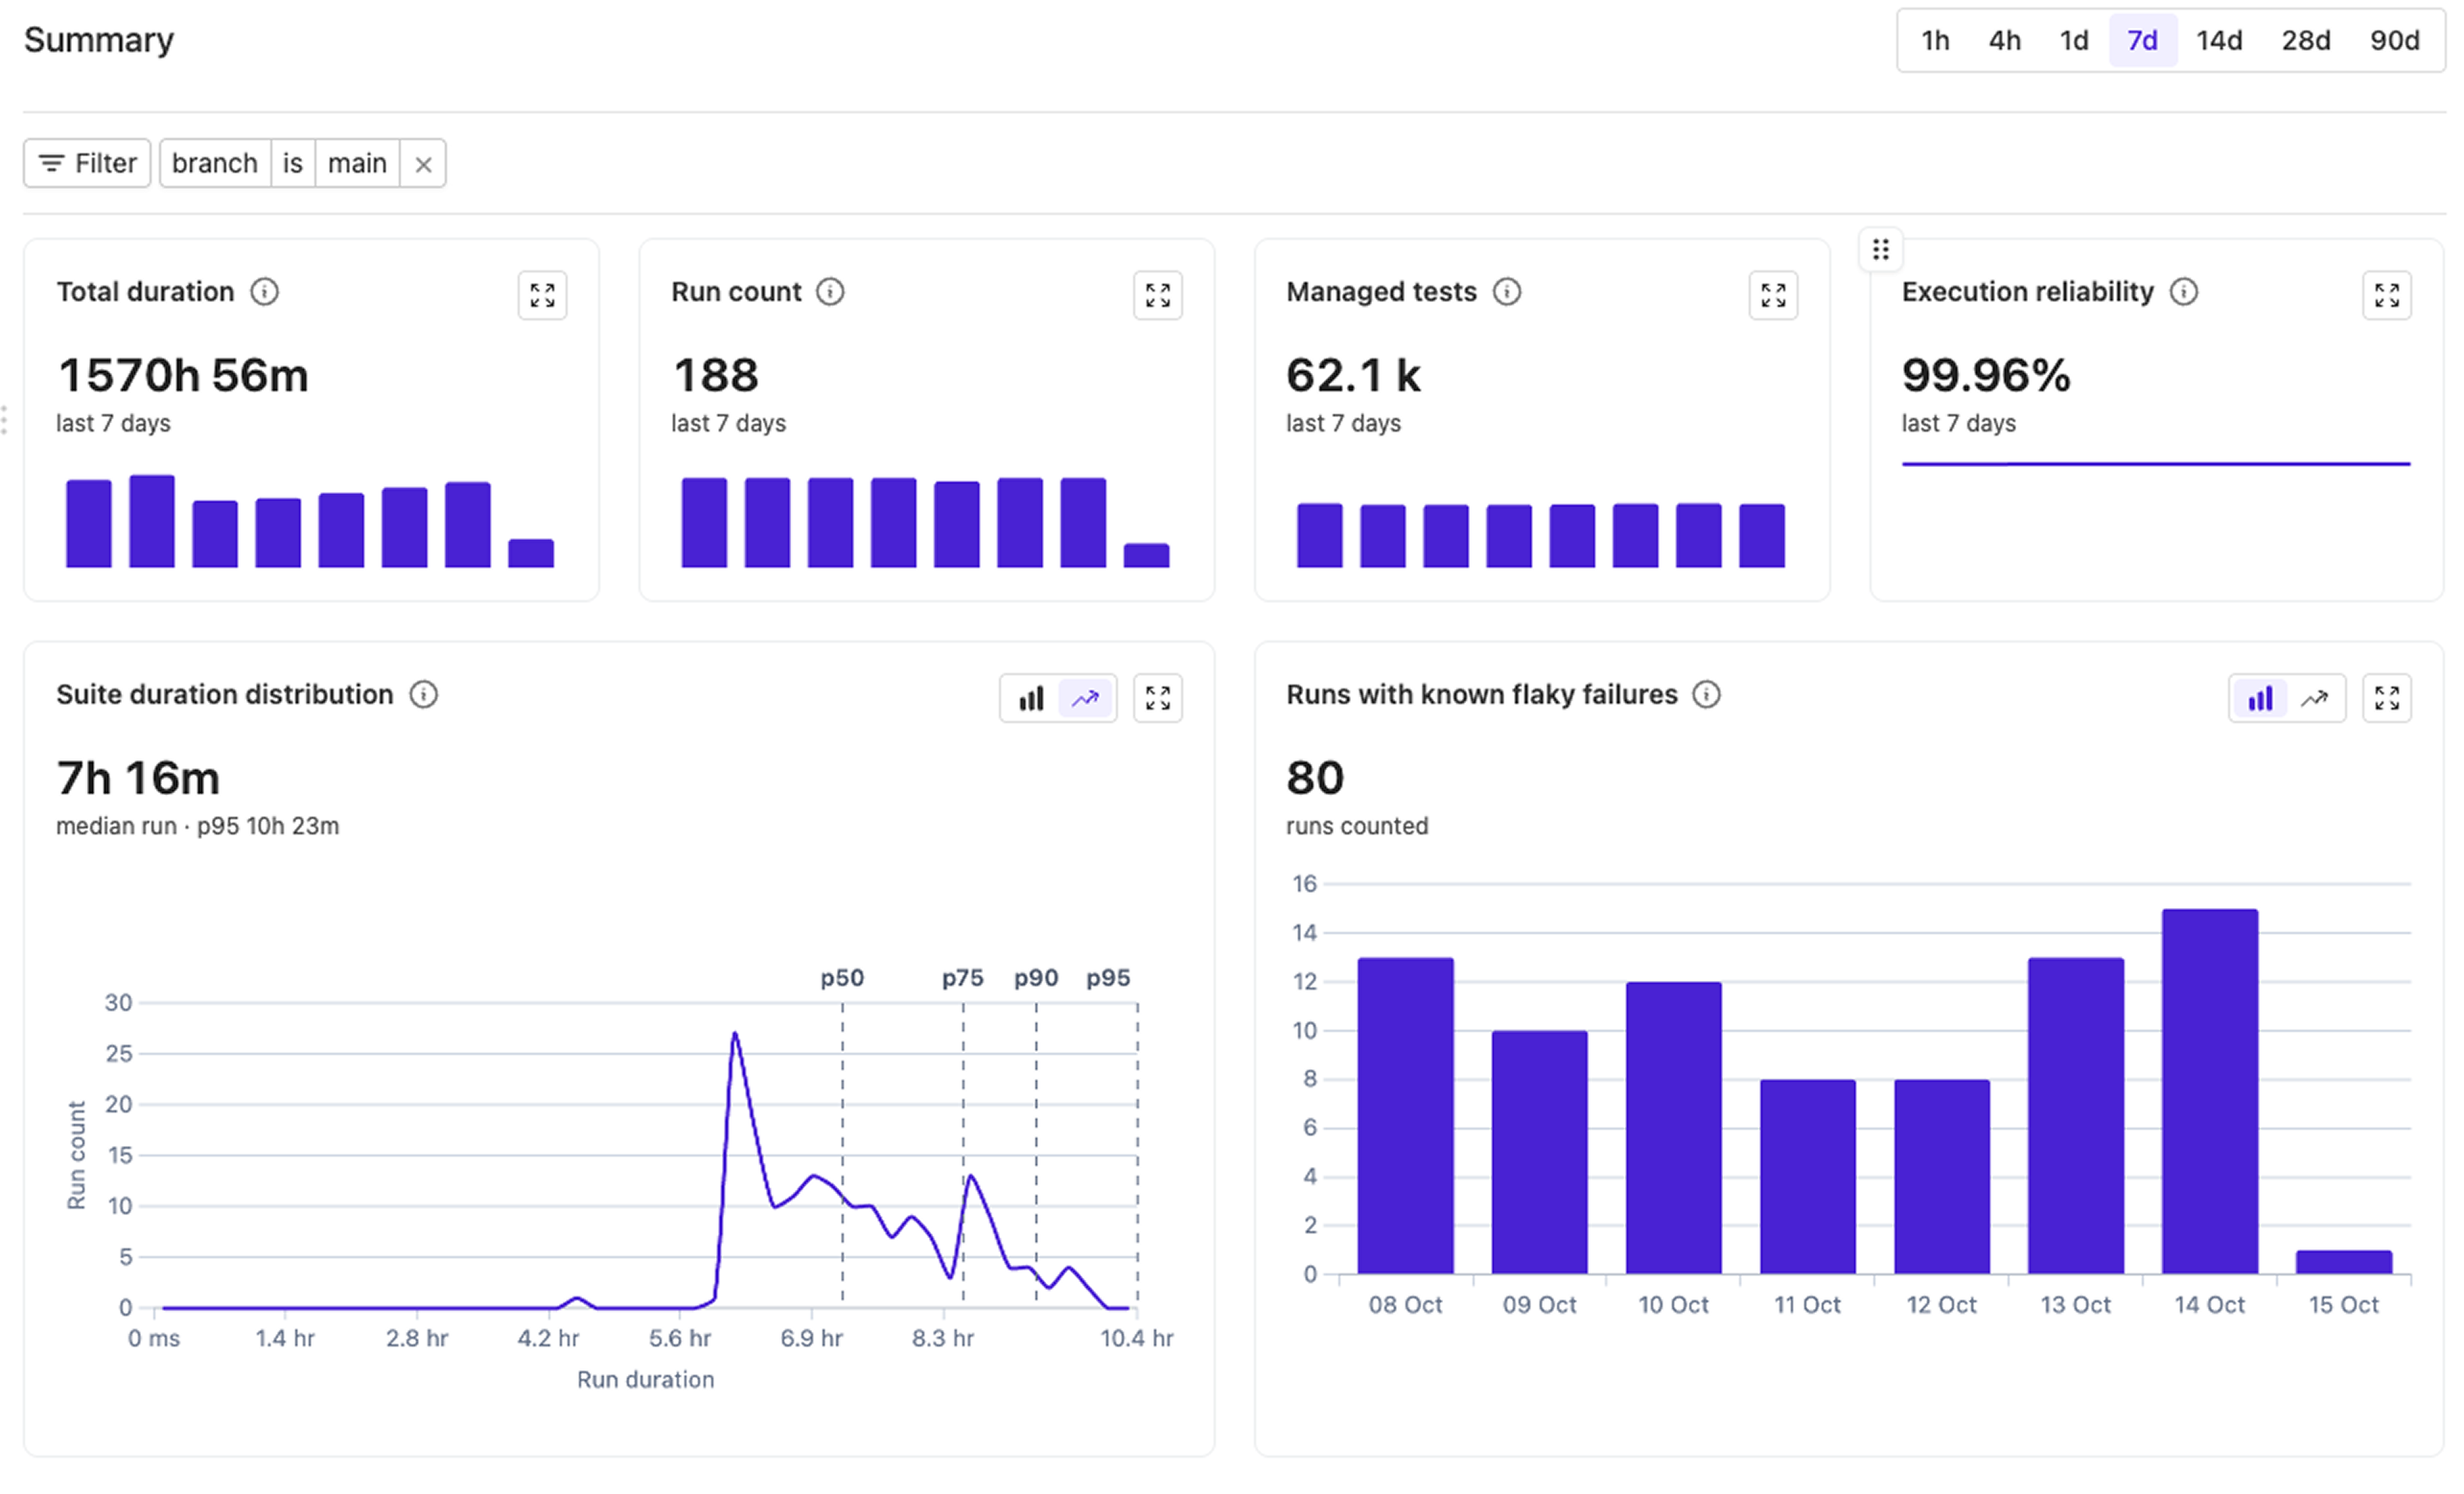
Once your test suite is set up, you'll have many types of information automatically calculated and displayed to help you surface and investigate problems in your test suite.
The Summary and Test pages are able to be filtered by branch, result (for example, pass, fail), state (for example, enabled, disabled), owner (for example, core-team, platform-team), label (for example, flaky, slow, feature-test) and tag. This allows greater flexibility and deeper analysis into the performance of your test suite.
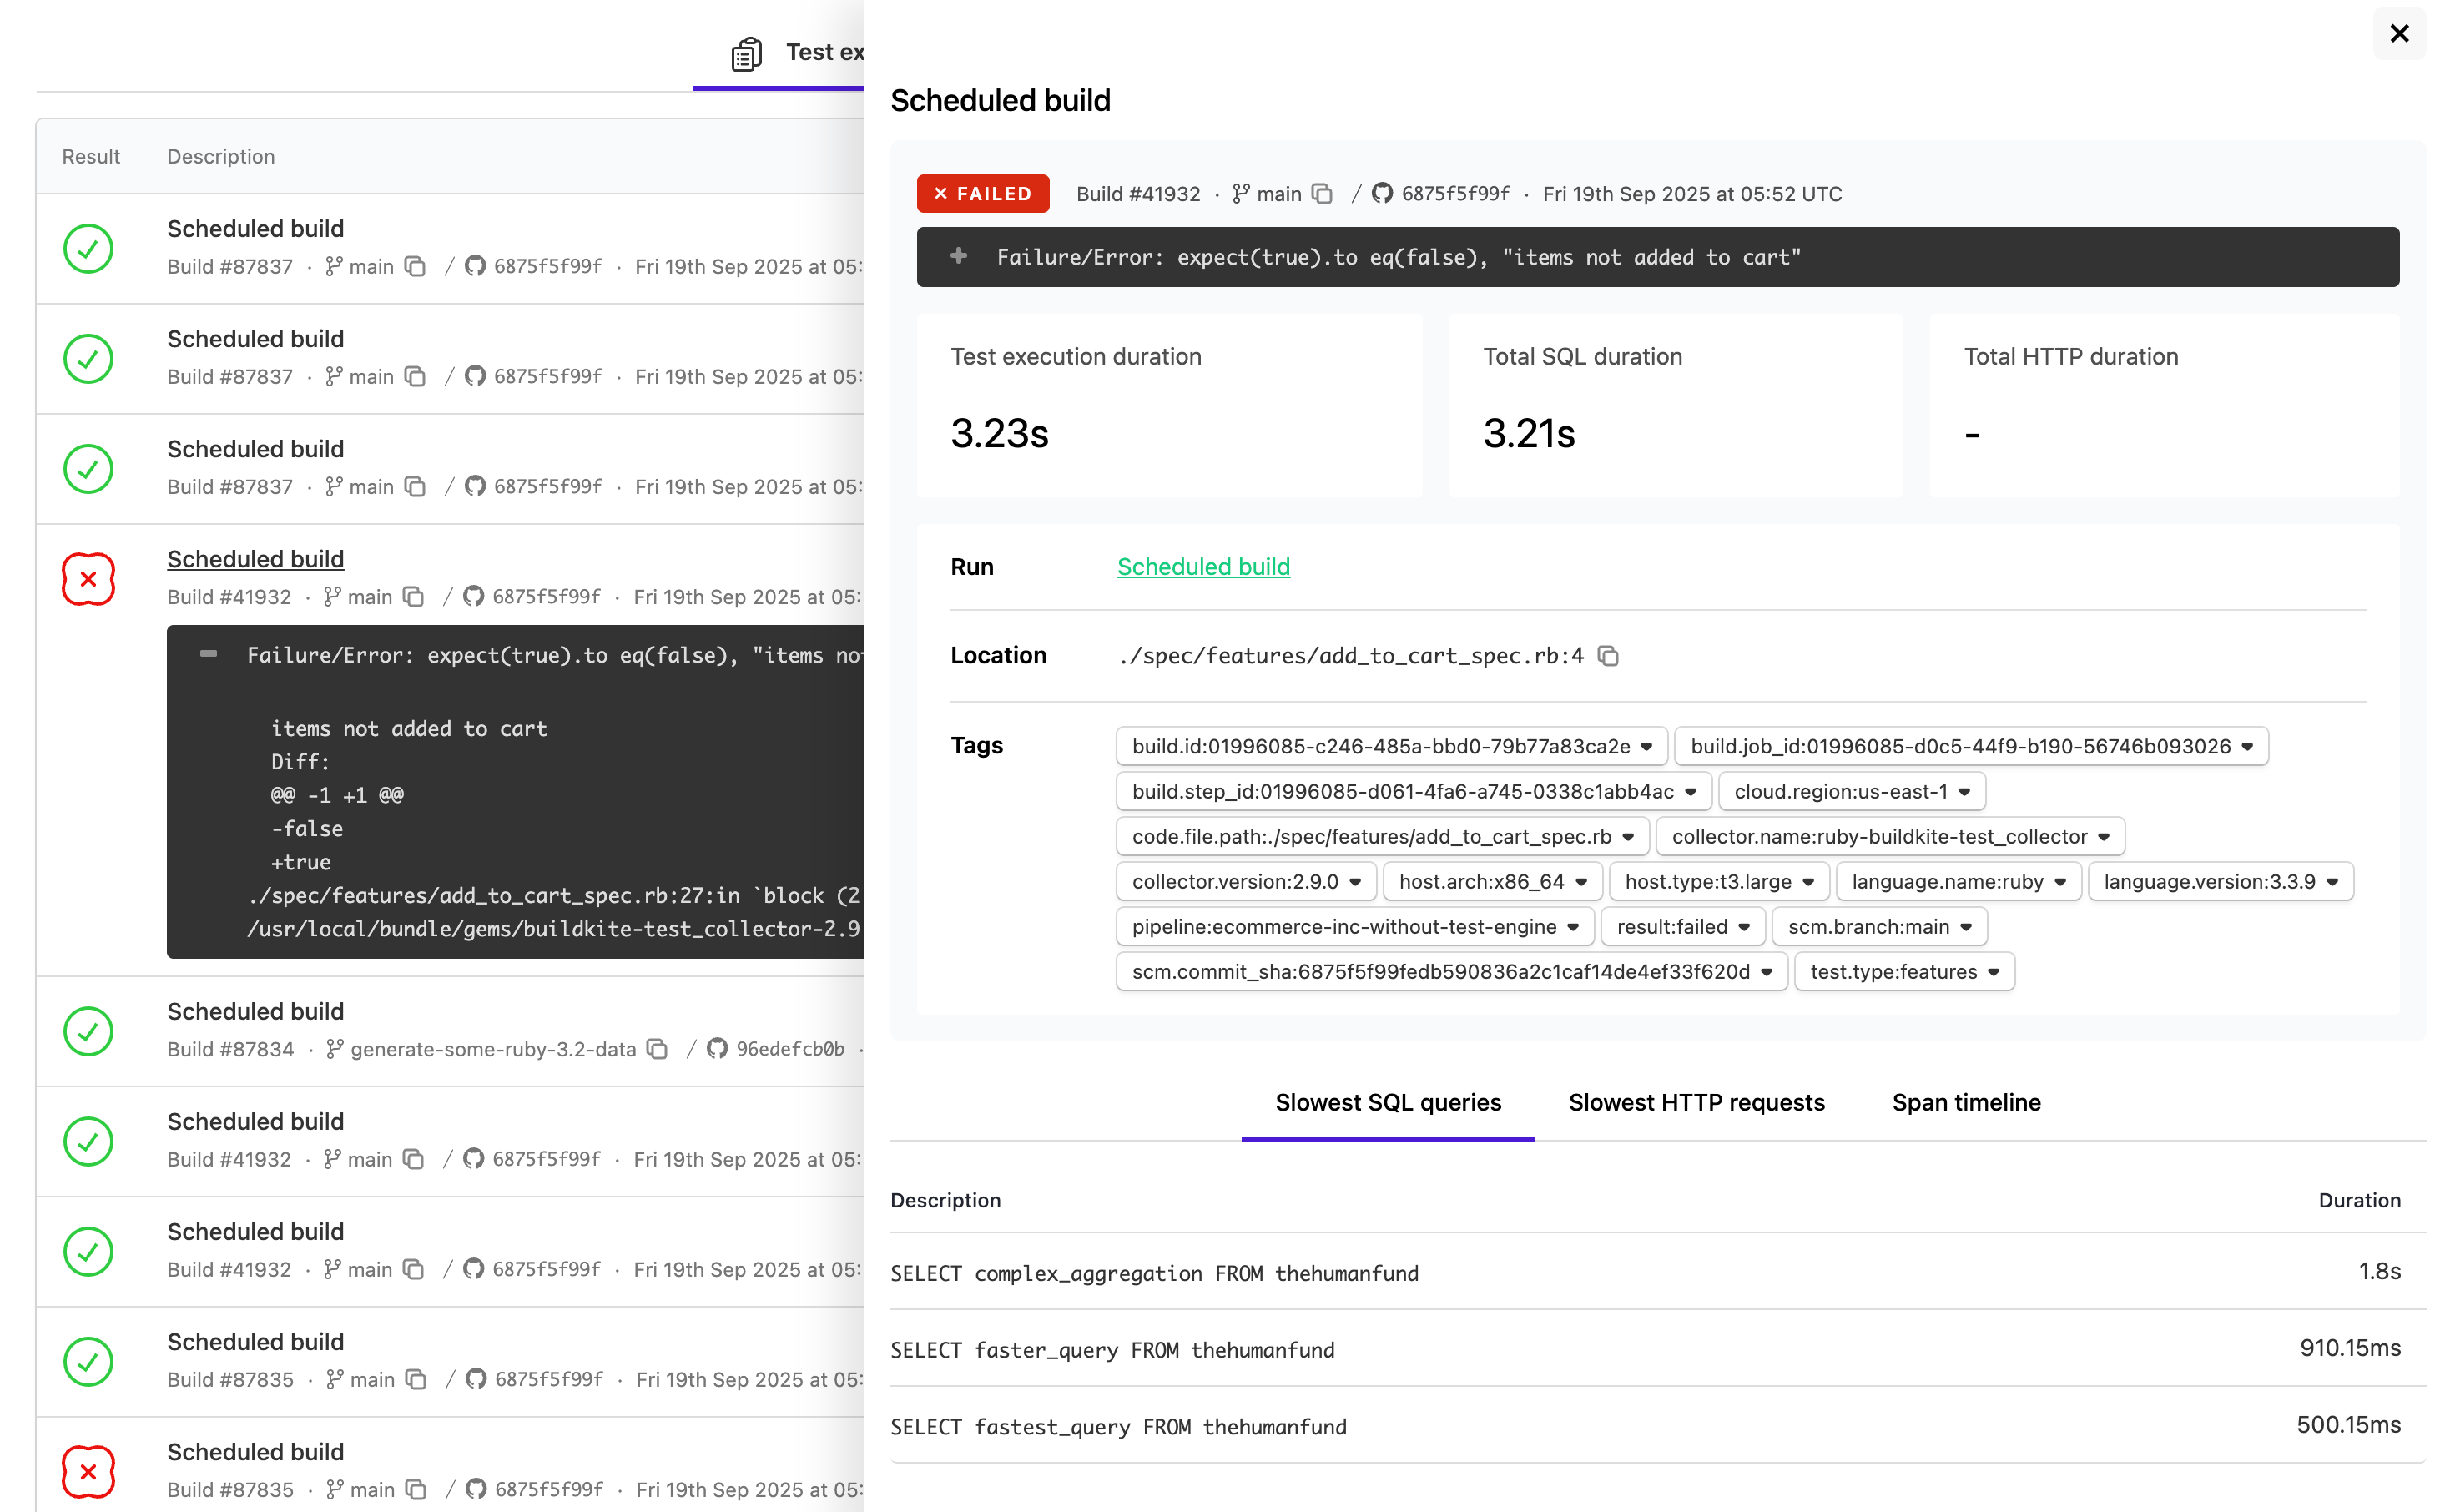
Select any individual test execution to see more trend and deep-dive information.
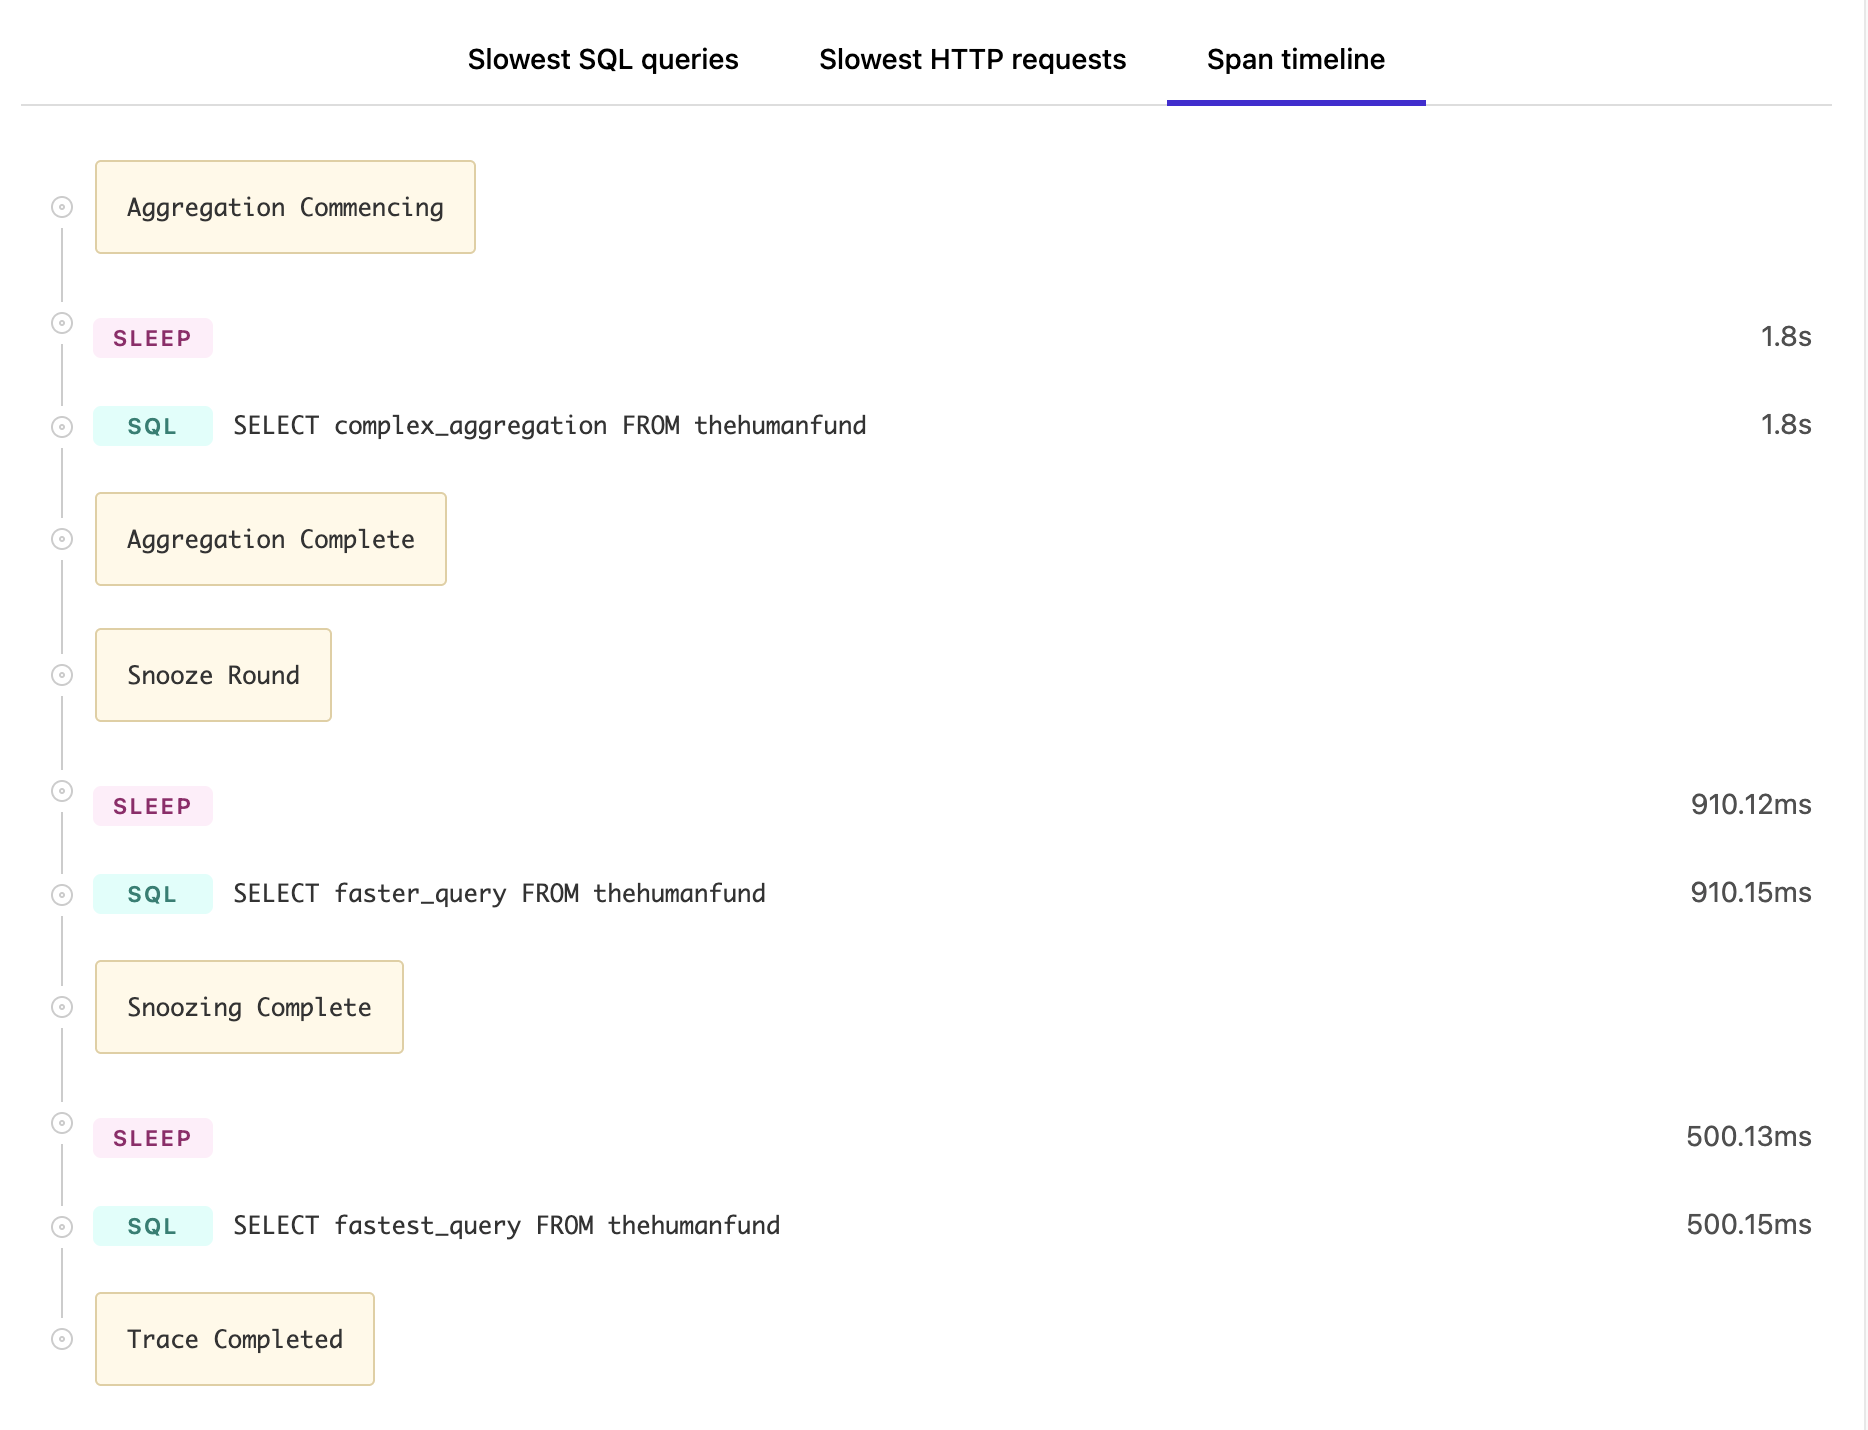
You can also annotate span information to help investigate problems, and see detailed log information inside Test Engine for any failed test or run.
Summary widgets
Summary widgets and layout editing are currently available in preview and must be enabled by Buildkite for your organization. Until they're enabled, the Summary page shows its existing charts and tables, without the Edit layout button. Contact Buildkite support to request access.
The Summary page shows your suite's charts and tables in widgets. Chart widgets show a key metric above the chart, so you can see the headline value at a glance. On wider screens, widgets sit side by side in a grid. On narrower screens, they stack.
Each chart adapts to the width of its widget. Wide widgets show the full chart, with axes, a legend, and a tooltip when you hover over the chart. Narrow widgets show a simplified chart with a shorter title. Select a narrow widget to open its detailed chart. On wider chart widgets, select the Maximise icon to open the detailed chart in a dialog.
If a widget doesn't apply every filter you've set on the Summary page, a warning icon appears next to its title. Select the icon to see which filters it ignores and why.
Customize the Summary layout
Users with Full Access to a test suite can change the layout of its Summary page. Users with Read Only access see the saved layout without editing controls.
Each suite has one saved layout, and everyone who views the suite sees the same widgets, in the same order and at the same widths. If two users edit the layout at the same time, the last one to save replaces the other's changes. The layout doesn't change when you switch between saved views.
By default, the Summary page shows the suite's metric charts, Test statistics, and Recent runs. These other widgets start hidden:
- Suite duration distribution
- Test duration distribution
- Flaky tests added and resolved
- Runs with known flaky failures
- Workflow activity
- Slowest tests
The Widgets menu only lists widgets that can show data for the suite:
- Flaky tests added and resolved and Runs with known flaky failures are listed only when the suite has tests labeled as flaky.
- Workflow activity is listed only when the suite has an active workflow.
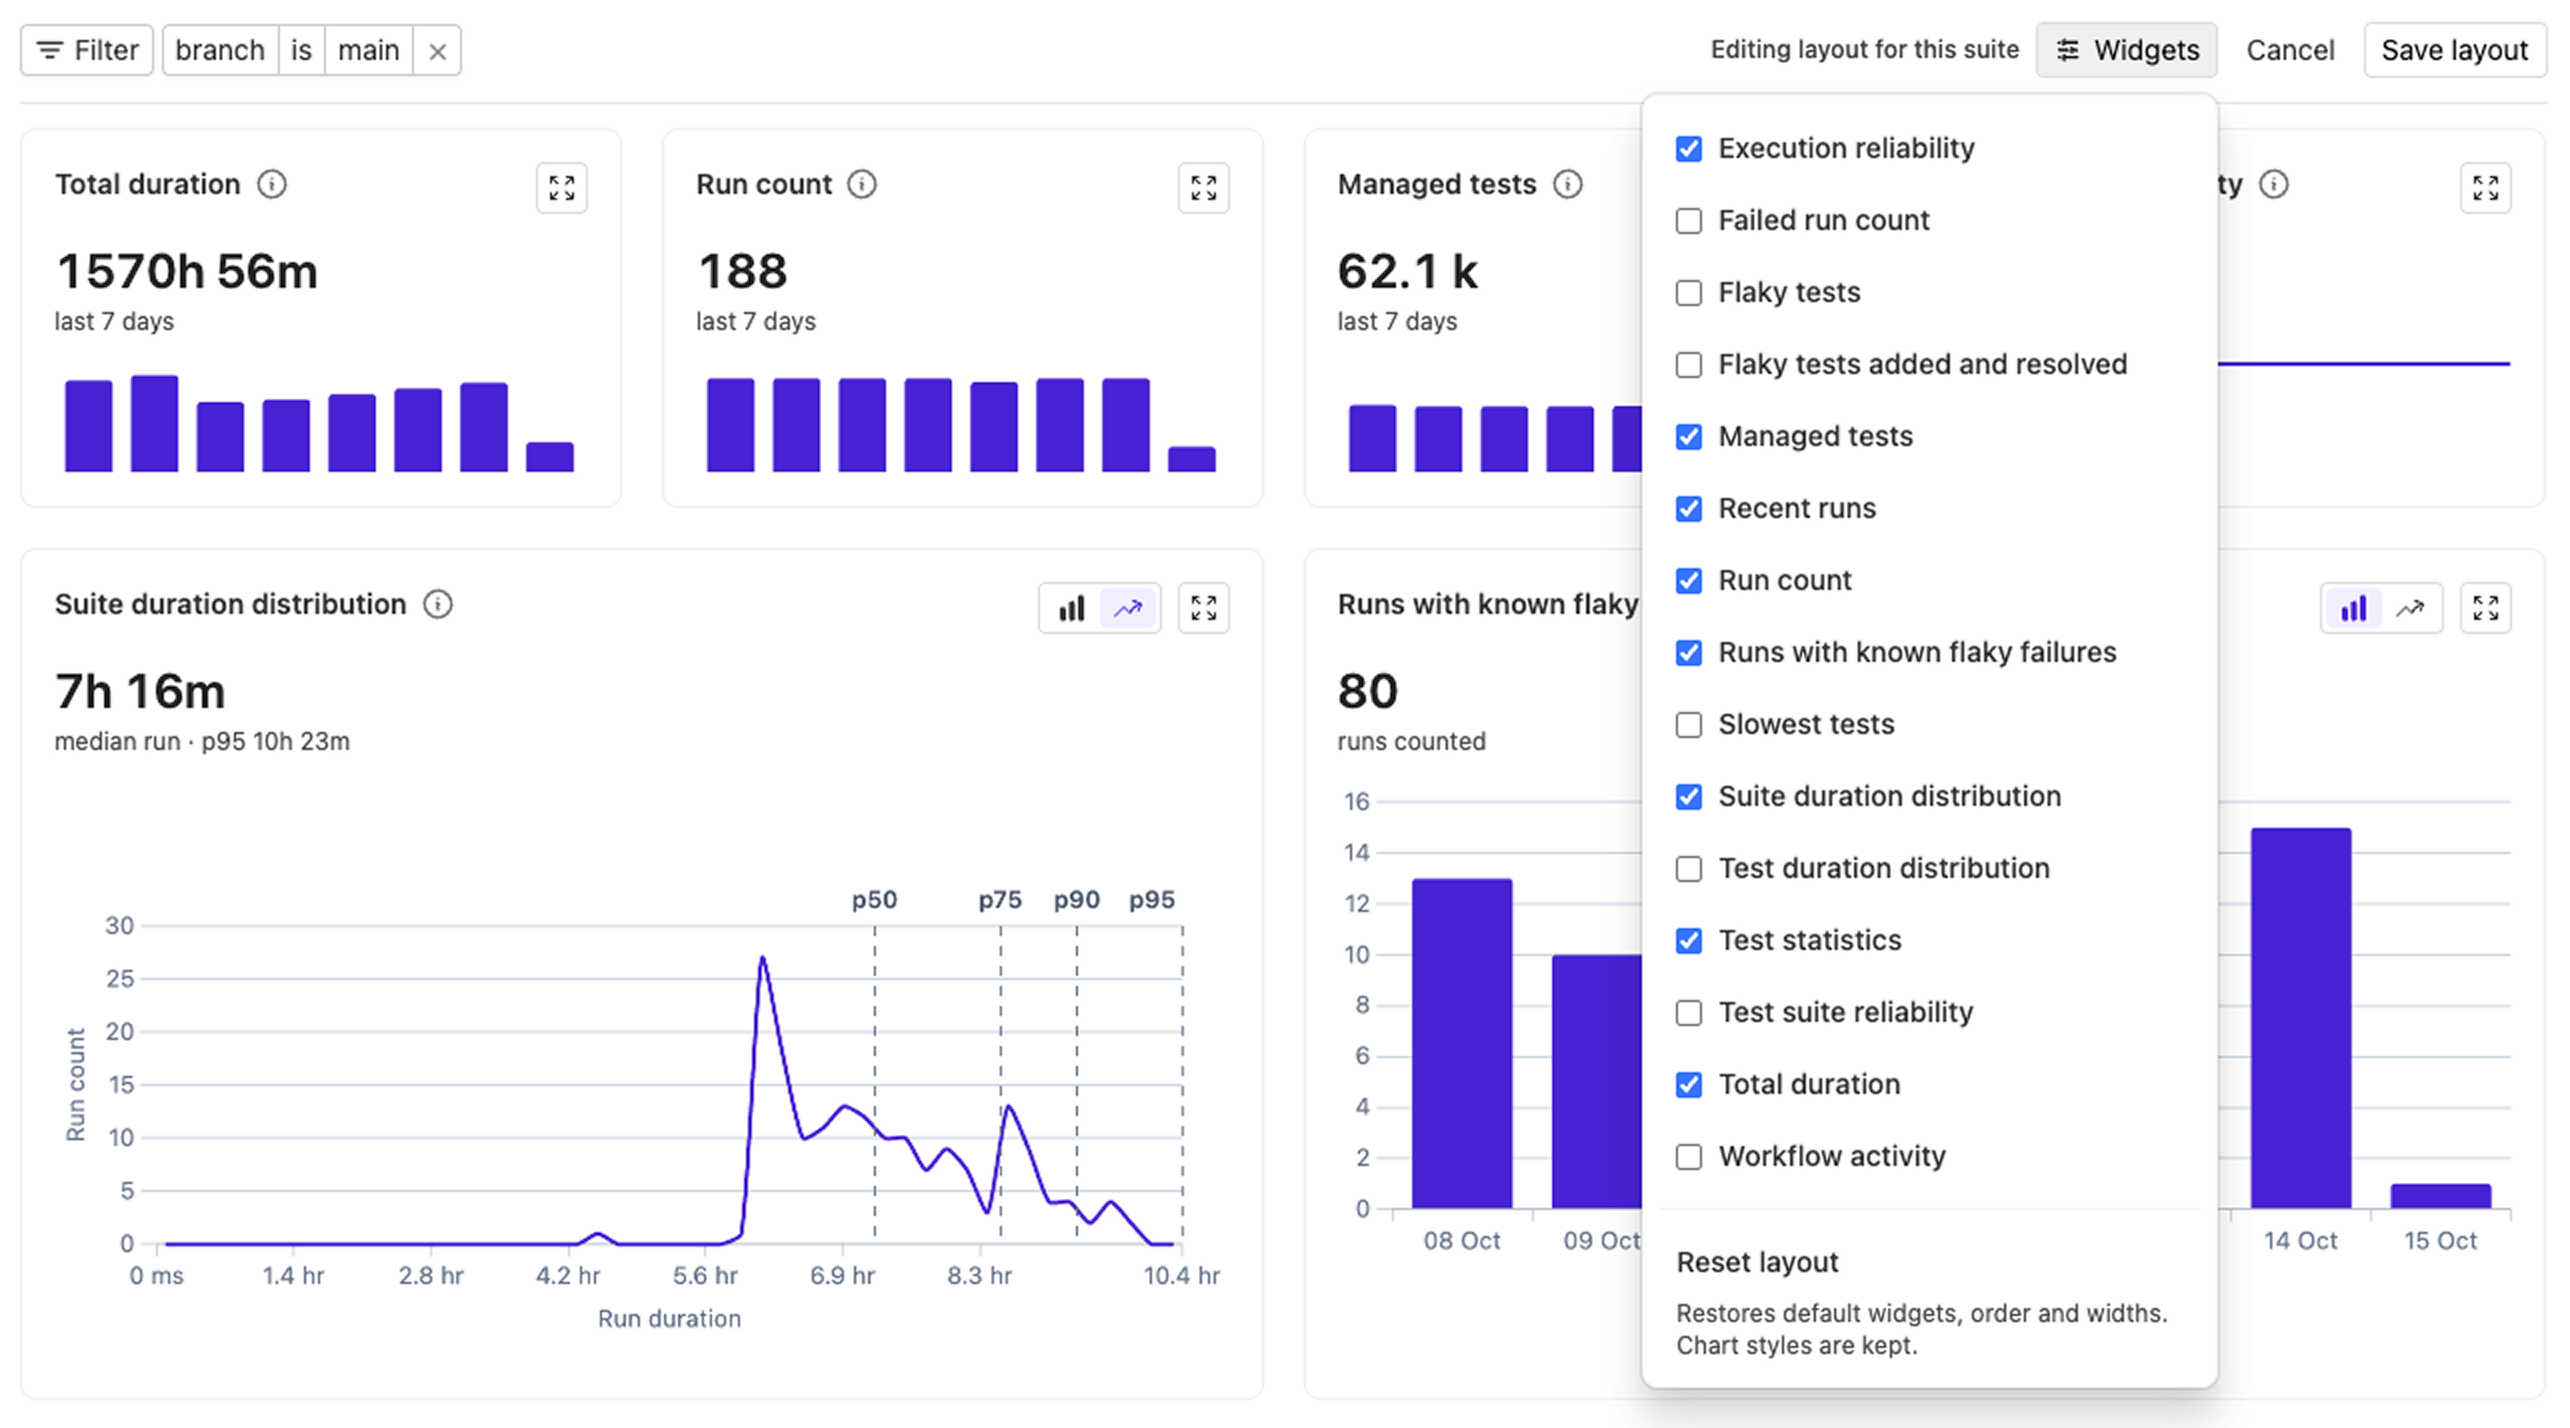
To change the layout:
- On the test suite's Summary page, select Edit layout.
- Make your changes:
- To show or hide a widget, select Widgets, then select or clear the widget. A widget you show is added in a new row at the bottom.
- To move a widget, drag its handle, or focus the handle and use the arrow keys.
- To move a whole row, drag the handle at the start of the row, or focus that handle and use the Up and Down arrow keys.
- To resize a widget, drag the divider next to it, or focus the divider and use the Left and Right arrow keys. You can also focus the handle of the widget and press Shift with the Left or Right arrow key. Each row is four units wide. Some widgets, such as Recent runs, always use the full width.
- To switch a chart between bar and line styles, select the bar chart or line chart icon at the top of the widget. For a narrow widget, open its detailed chart first.
- Select Save layout to save your changes for everyone, or select Cancel to discard them.
To go back to the default widgets, order, and widths, select Widgets > Reset layout while editing, then select Save layout. Resetting keeps each chart's style.
If you try to leave the page with unsaved changes, including with your browser's back button, a dialog asks you to confirm. Select Keep editing to stay, or Discard changes to leave without saving. Changing the grouping or page of the Test statistics table doesn't discard your changes.