Using Buildkite with Honeycomb
Honeycomb is an observability and application performance management (APM) platform that helps you monitor and debug your applications.
Honeycomb offers several advantages for Buildkite Pipelines users:
- Free plan available: start monitoring your builds without additional costs.
- Build grouping: group traced jobs into a single build for better visibility.
- Comprehensive tracing: track performance and identify bottlenecks in your CI/CD pipeline.
Honeycomb integration methods
You can integrate Honeycomb with Buildkite Pipelines using three methods:
- buildevents binary: the buildevents binary captures detailed trace telemetry for each build step. Learn more about configuring this method in Using the buildevents binary.
- OpenTelemetry tracing: setting your OpenTelemetry tracing notification endpoint to Honeycomb sends traces directly from the Buildkite agent. Learn more about configuring this method in Using OpenTelemetry tracing.
- Honeycomb Markers Buildkite plugin: the Honeycomb Markers Buildkite plugin adds Buildkite Pipelines markers to your traces. However, for security best practice reasons, it is not recommended using this plugin as it is community-maintained with irregular updates.
Using the buildevents binary
The buildevents binary generates trace telemetry for your builds, and captures invocation details and command outputs, creating a comprehensive trace of your entire build process.
How it works
The buildevents binary:
- Creates spans (individual or grouped executed commands) for each build section and subsection.
- Tracks the duration of each stage or command.
- Records success/failure status and additional metadata.
- Sends the complete trace to Honeycomb when the build finishes.
buildevents trace structure
The buildevents script needs a unique Trace ID to connect all the relevant steps and commands with its build. You can use Buildkite Pipeline's BUILDKITE_BUILD_ID environment variable, since its value is unique (when re-running builds, you'll get a new BUILDKITE_BUILD_ID), and it is also a primary value that Buildkite Pipelines uses to identify the build.
You can get started with buildevents from the installation instructions for buildevents.
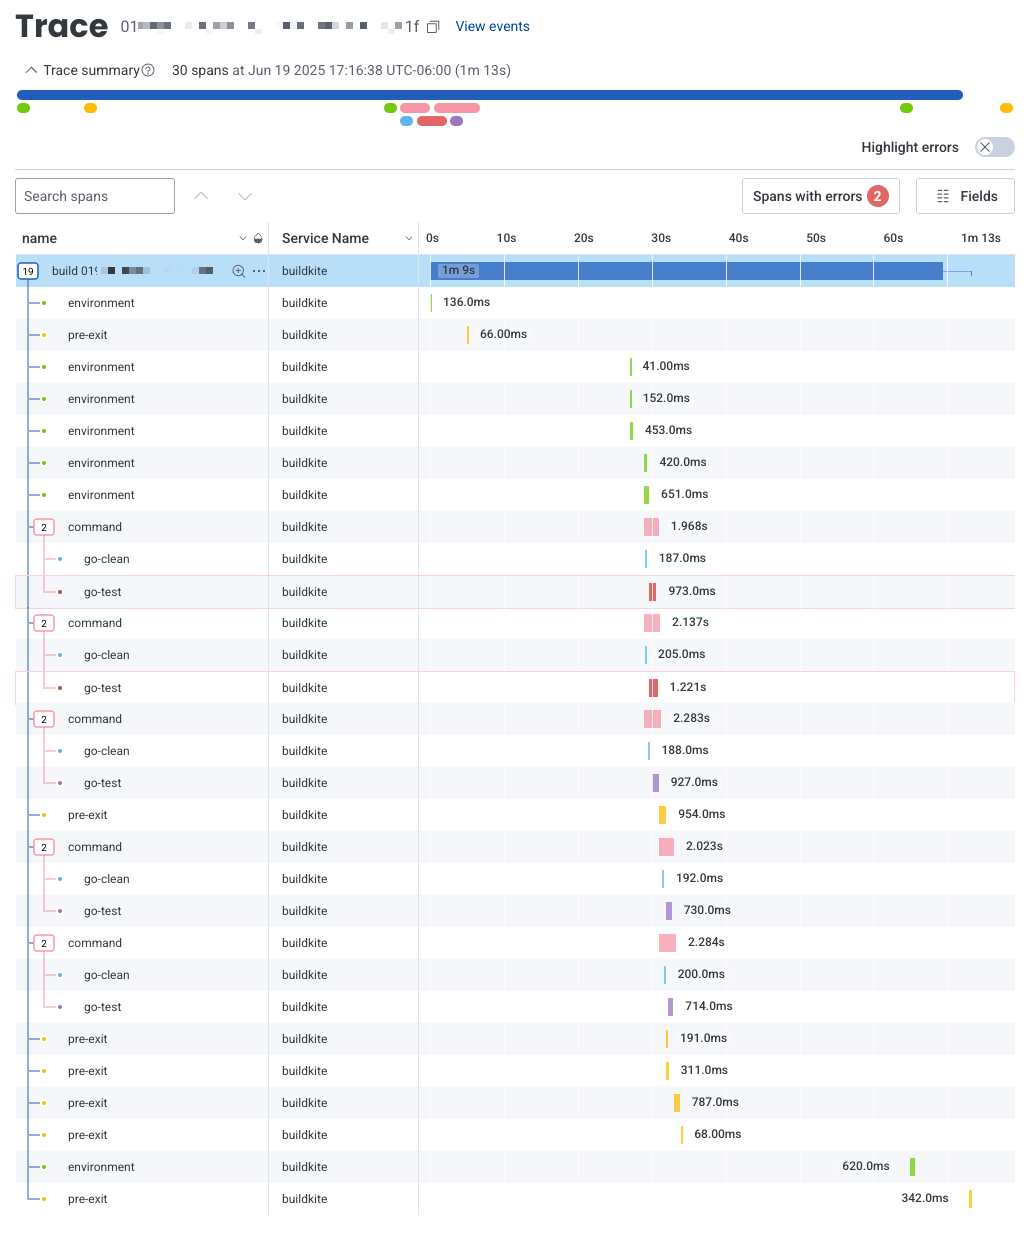
After integration, you'll see key telemetry from Buildkite pipelines in Honeycomb's Traces dashboard. Each trace typically represents a full build, and each span represents a job or command.
Metrics visible in this dashboard include:
- Spans: count of all job steps traced.
- Duration data: visualizes step performance for latency analysis.
- Status information: success or failure details.
- Custom metadata: additional data you choose to capture.
-
Total Errors: Spans marked with
error=true, useful for tracking CI failures. - Trace Volume: One per build, shows build frequency.
Since Honeycomb maintains the buildevents integration, direct questions and feature requests through to Honeycomb Support.
Explore data view
The Explore Data tab lets you inspect spans as individual structured events. You can filter by tags like trace.trace_id, command_name, error, or duration_ms. This is helpful for isolating problematic steps, long durations, or agent behavior.
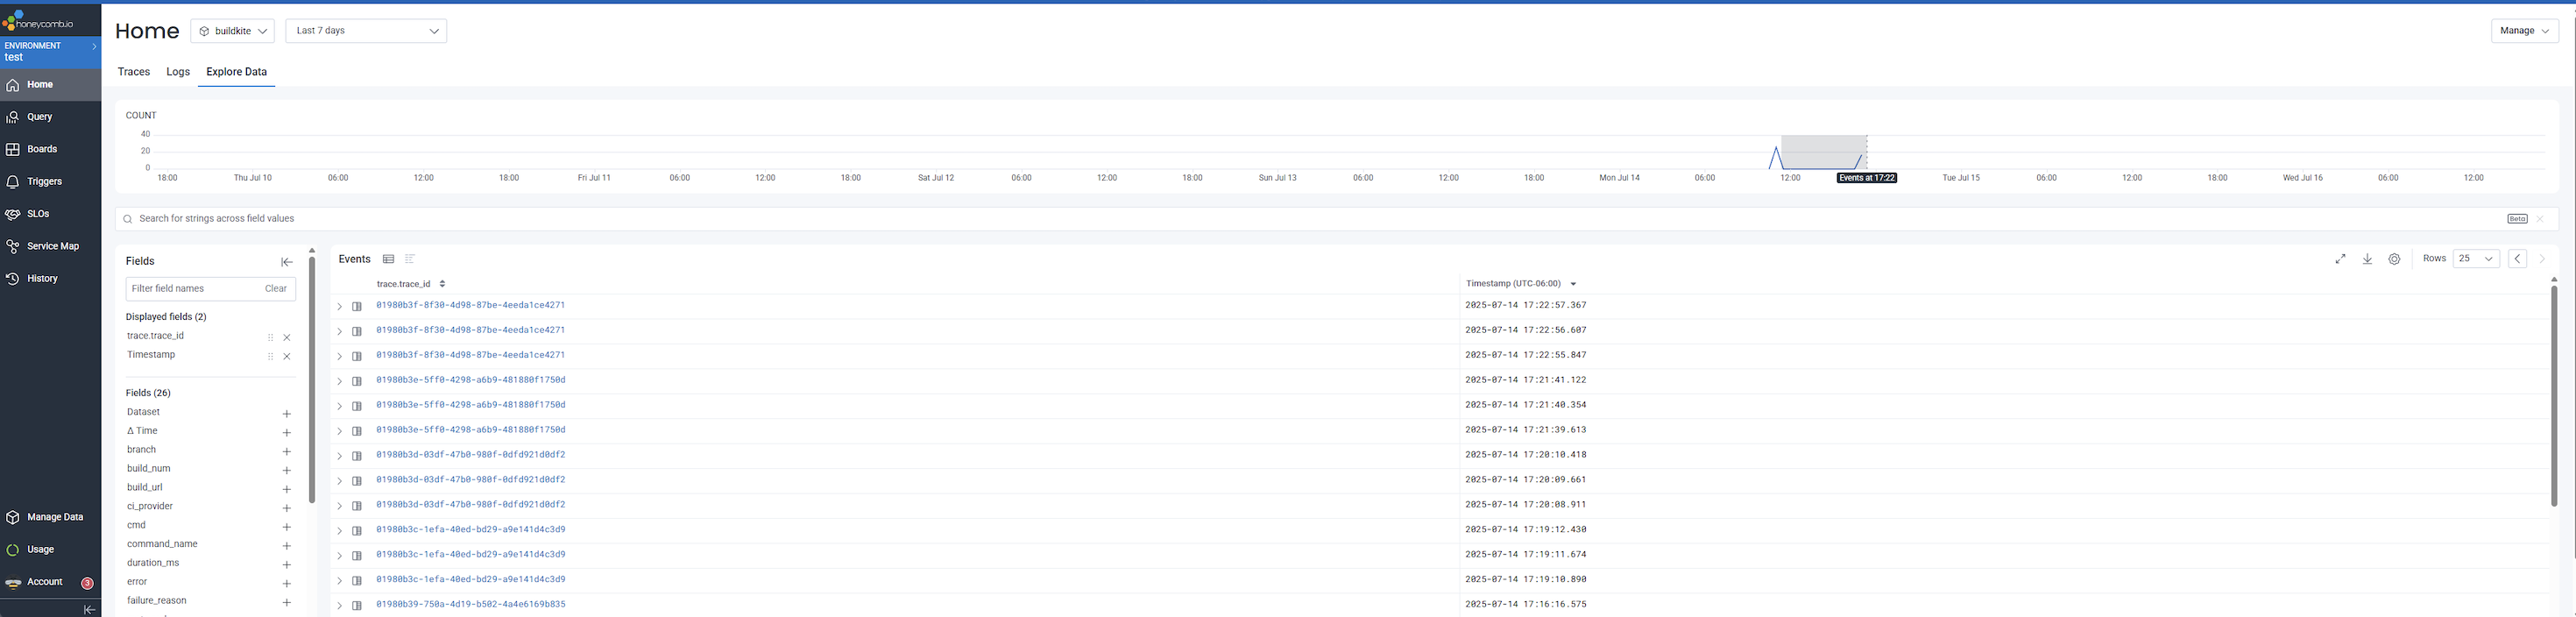
Selecting a trace ID opens the flame graph (trace view), showing the full build execution timeline.
Using OpenTelemetry tracing
You can send traces from the Buildkite agent to Honeycomb with the help of OpenTelemetry by following these steps:
Enable OpenTelemetry tracing by setting the
--tracing-backend opentelemetryflag on your Buildkite agent.-
Set the following values in the environment where you are running the Buildkite agent:
OTEL_EXPORTER_OTLP_TRACES_ENDPOINT="https://api.honeycomb.io"
OTEL_EXPORTER_OTLP_HEADERS="x-honeycomb-team=<api_key>"
OTEL_SERVICE_NAME="buildkite-agent"
Replace
<api_key>with your actual Honeycomb API key.For more details, see the OpenTelemetry tracing documentation.