Setting up Datadog tracing on a Buildkite pipeline
Datadog is a comprehensive monitoring and analytics platform that combines infrastructure monitoring, application performance monitoring, and log management, allowing you to track the health and performance of your systems while identifying and troubleshooting issues across your entire deployment pipeline.
Datadog users can send the information about their Buildkite pipelines to Datadog's Continuous Integration (CI) Visibility product, also known as CI Pipeline Visibility, if the Datadog Pipeline Visibility notification service was enabled in Buildkite. This way, any organization using both Datadog and Buildkite Pipelines can gain insights into the performance of their pipelines over time and ensure optimal resource utilization throughout their development workflow.
Using Datadog APM
To use Datadog's Application Performance Monitoring (APM) integration, launch the Buildkite agent with the --tracing-backend datadog flag.
buildkite-agent start --tracing-backend datadog
This will enable Datadog APM tracing, and send the traces to a Datadog Agent at localhost:8126 by default.
Learn more about the Datadog Agent and how to install it from Datadog's Agent documentation.
If your Datadog Agent is located at another host, the Buildkite agent will respect the DD_AGENT_HOST and DD_TRACE_AGENT_PORT environment variables defined by dd-trace-go. Note that there will need to be a Datadog Agent present at the above address to ingest these traces.
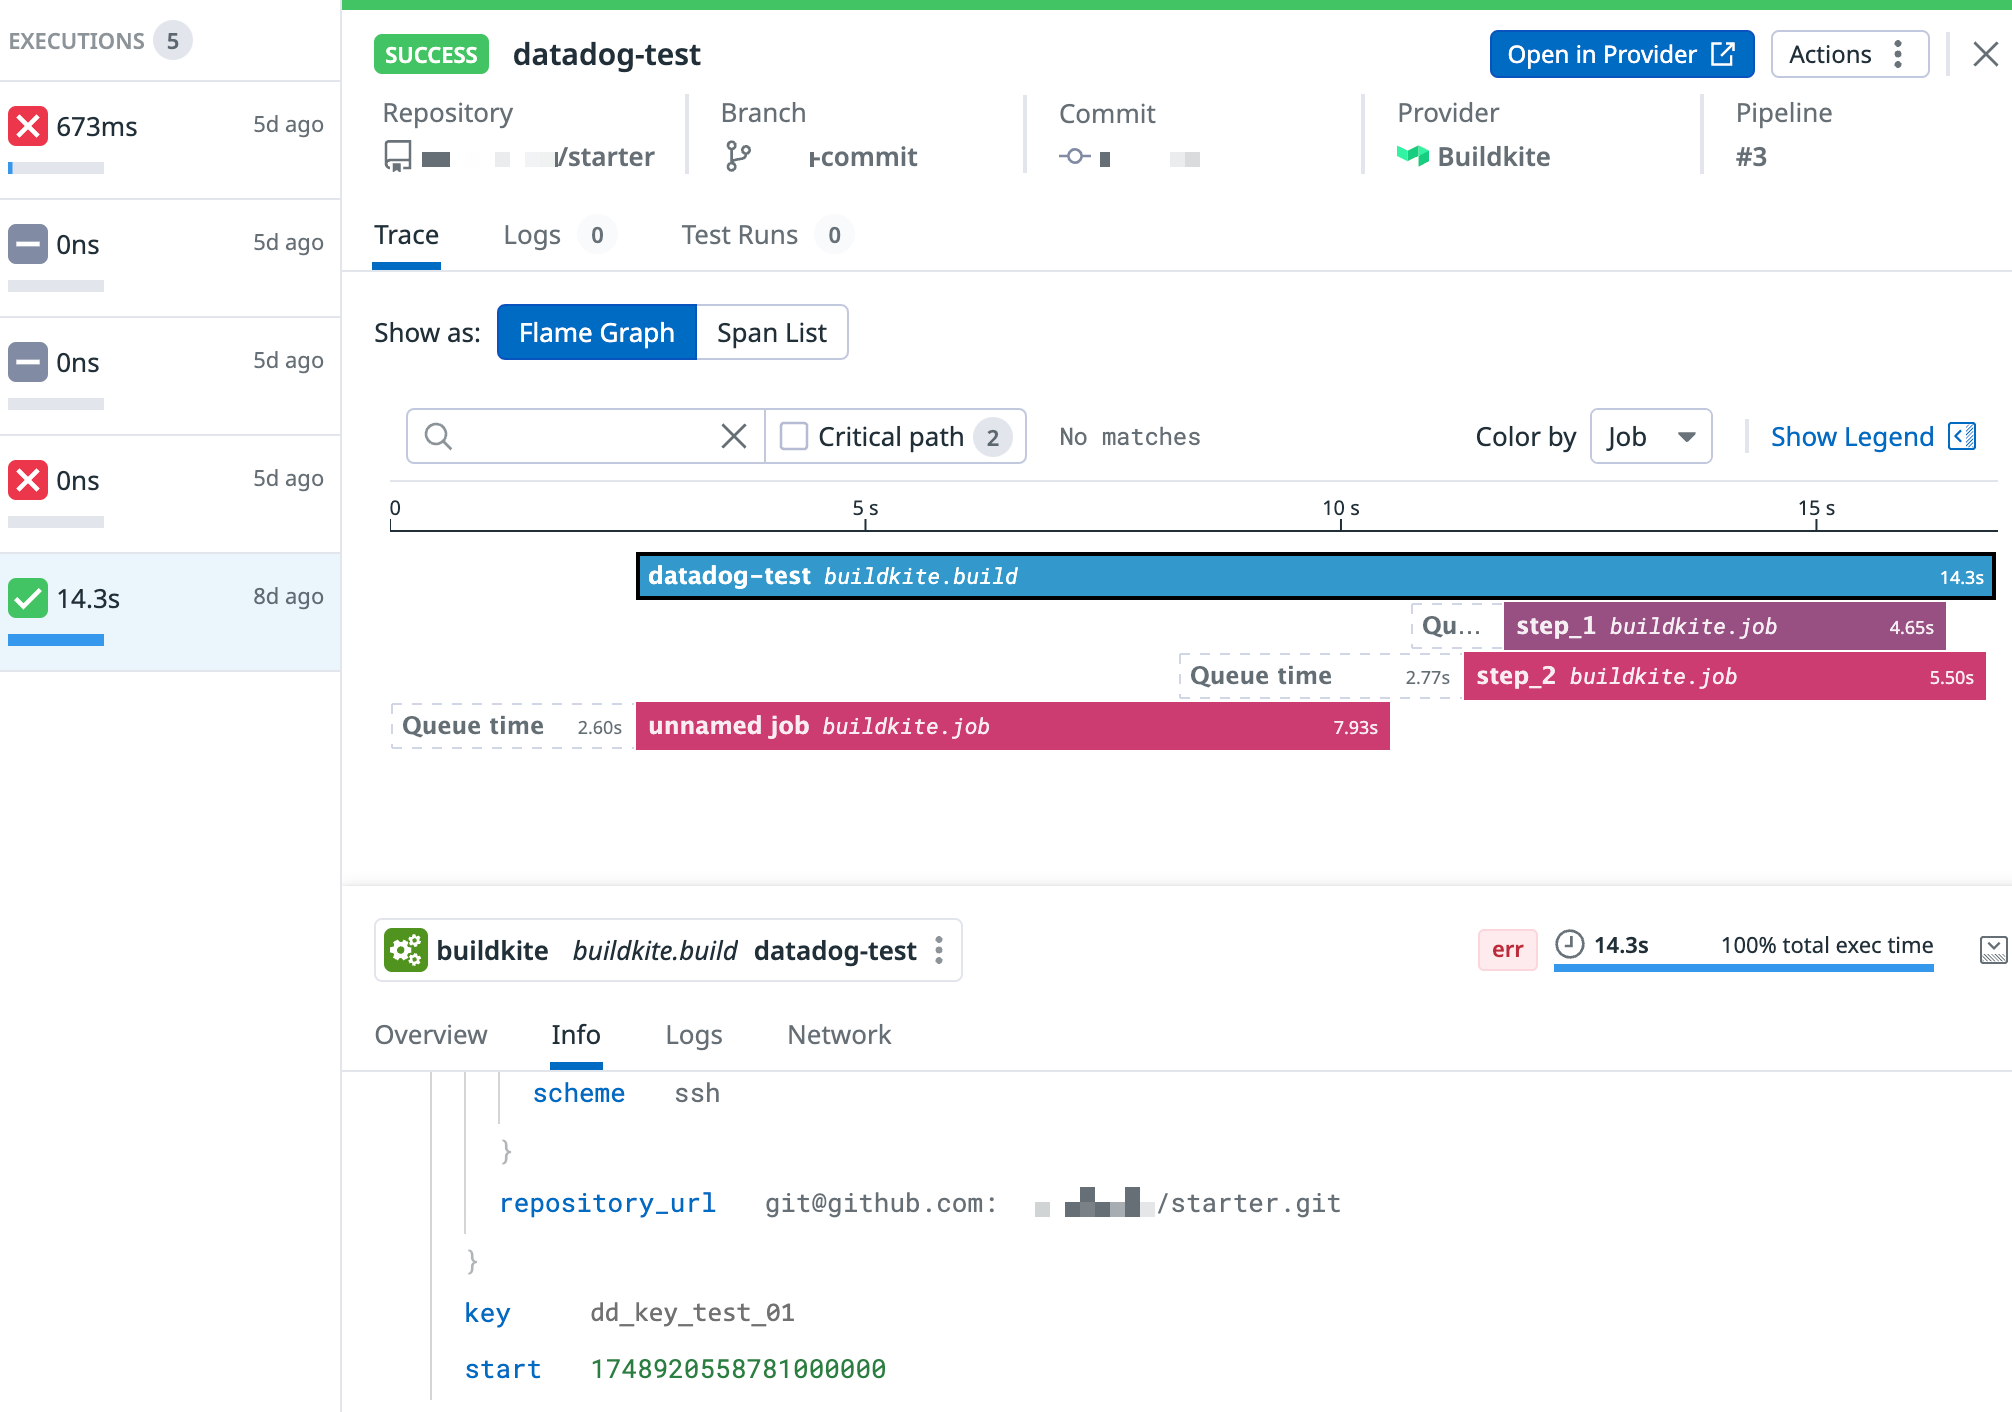
Once the Buildkite agent is running with --tracing-backend datadog, you must run at least one job on that agent to generate trace data. After the job runs, go to Datadog > APM > Traces to view the traces.
Once Datadog APM is integrated with Buildkite Pipelines, you gain full visibility into your CI pipeline through detailed tracing of Buildkite agent activity. Each job execution is captured as a trace with individual spans representing key phases such as hook execution, command runtime, and lifecycle events like pre-exit or post-command. These spans provide real-time insights into duration, performance bottlenecks, and potential failures across your builds. With built-in filtering, service tagging, Datadog enables deep observability into your CI workflows, making it easier to troubleshoot, optimize, and maintain high pipeline reliability.
Configuring the Datadog integration in Buildkite
To set up the Datadog's CI Pipeline Visibility integration for Buildkite:
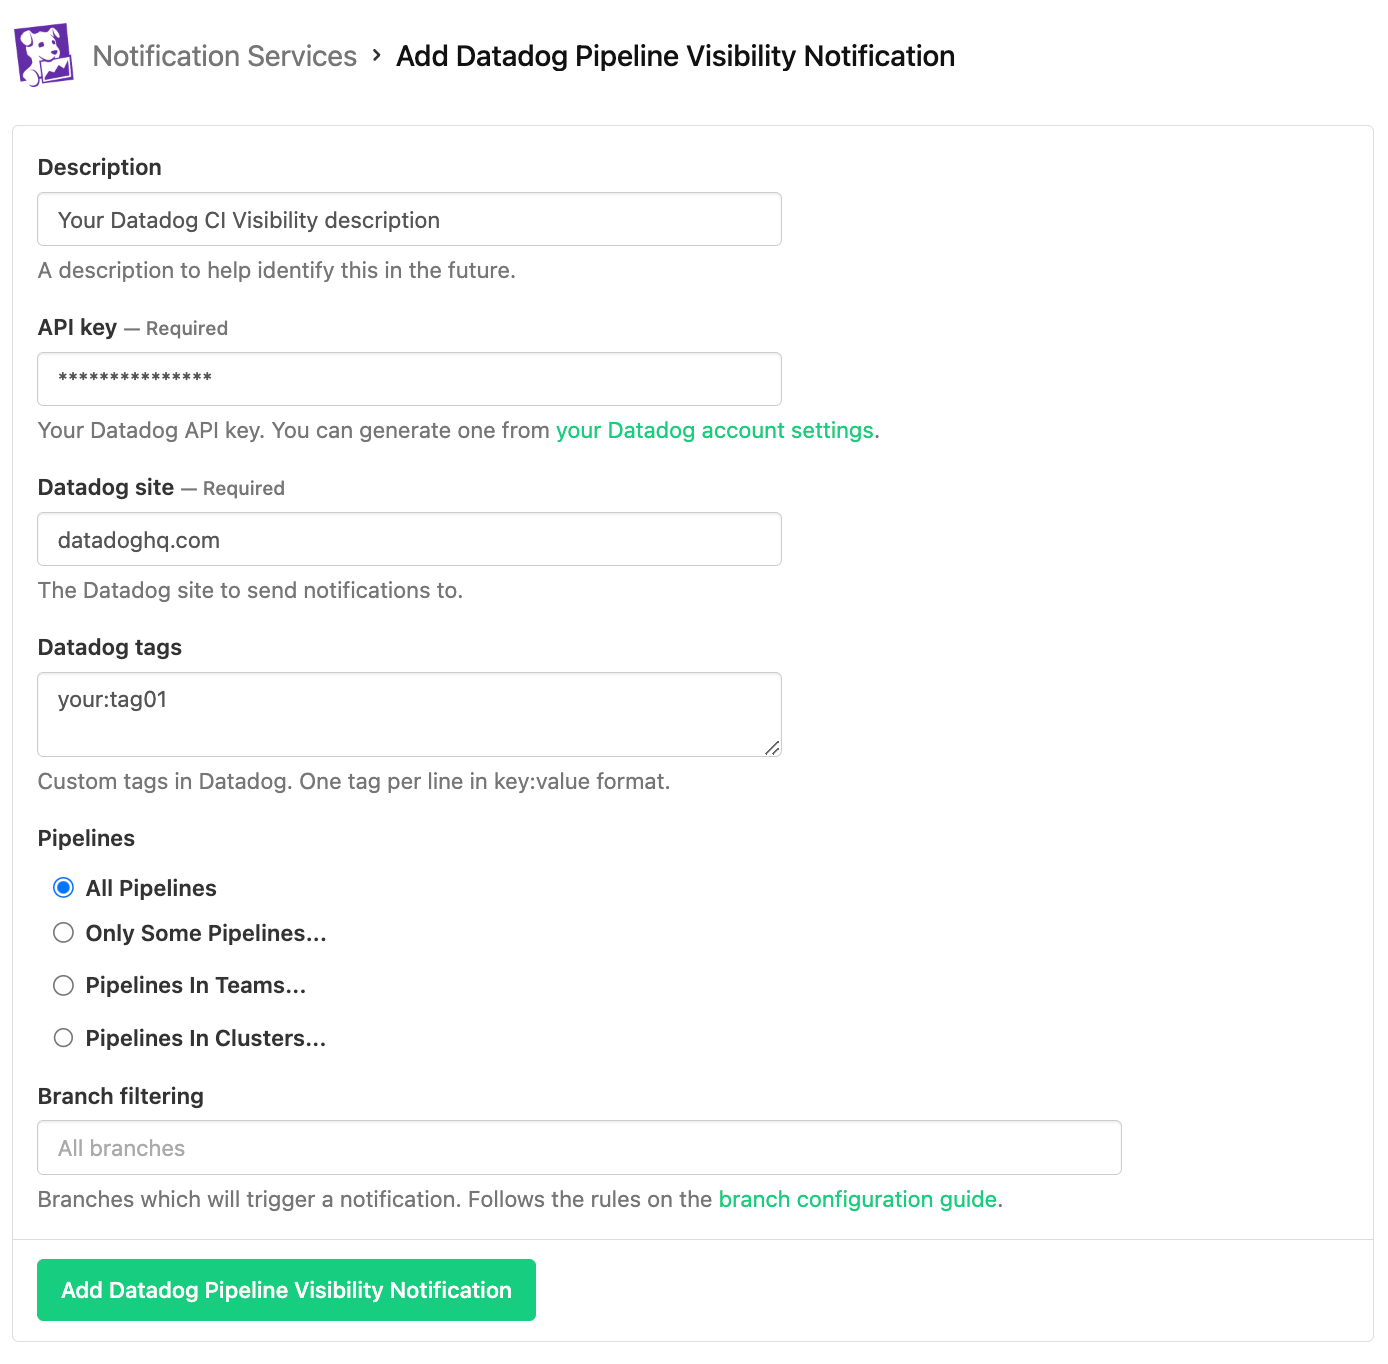
As a Buildkite organization administrator, go to Settings > Notification Services and select the Add button next to Datadog Pipeline Visibility.
-
Complete in the following fields:
-
Description: A description to help identify this integration in the future, for example
Datadog CI Pipeline Visibility. - API key: Your Datadog API Key. You can generate it in your Datadog account settings.
-
Datadog site: The URL of your Datadog site to send notifications to, which is typically
datadoghq.com. While this is the default value of this field, depending on your location, you might wish to use a different site, for instance,us3.datadoghq.comorus5.datadoghq.comfor US orap1.datadoghq.comfor Japan. Learn more about these different sites and the current list of available websites to choose from in Getting Started with Datadog Sites. -
Datadog tags: your custom tags in Datadog. You can use one tag per line in
key:valueformat. -
Pipelines: you can select a subset of pipelines you want to trace in Datadog. Select from:
- All Pipelines.
- Only Some pipelines, where you can select specific pipelines in your Buildkite organization.
- Pipelines in Teams, where you can select pipelines accessible to specific teams configured in your Buildkite organization.
- Pipelines in Clusters, where you can select pipelines associated with specific Buildkite clusters.
- Branch filtering: specify the branches that will trigger trace notifications. You can leave this field empty to trace all branches or select a subset of branches you would like to trace, based on branch configuration and pattern examples.
-
Description: A description to help identify this integration in the future, for example
-
Click Add Datadog Pipeline Visibility Notification button to save the integration.
For the latest compatibility information on Datadog's side regarding this integration, please check the Datadog documentation.
Advanced configuration
The following configurations provide additional customization options to enhance the integration between Buildkite and Datadog's CI Pipeline Visibility. These settings allow you to fine-tune how pipeline data is collected and reported, ensuring you get the most valuable insights from your CI/CD metrics.
Setting custom tags
To create custom tags for filtering the CI Pipeline Visibility results, you can use buildkite-agent meta-data set command. Here is an example of how a tag can be set through a YAML pipeline configuration:
steps:
  - key: "dd_key_test_01"
    label: "step_01"
    command: "buildkite-agent meta-data set \"dd_tags.key\" dd_key_test_01"
...
After setting your tag and running a build of the pipeline, you'll be able to filter the CI Pipeline Visibility output results using the tag.
Numerical measures
Any metadata with a key that starts with dd_measures. and contains a numerical value, is set as a metric tag that can be used to create numerical measures. For example:
...
 - key: "dd-measures-01"
   label: "step_02"
   command: "buildkite-agent meta-data set \"dd_measures.memory_usage\" {numeric value}"
...
In the pipeline span for the resulting pipeline, you'll see a custom tag memory_usage:{numeric value}, for example memory_usage:1000.
Correlating infrastructure metrics to jobs
You can correlate jobs with the infrastructure that is running them. To do this, you need to install the Datadog Agent in the hosts that are running your Buildkite agents.
Visualizing pipeline data in Datadog
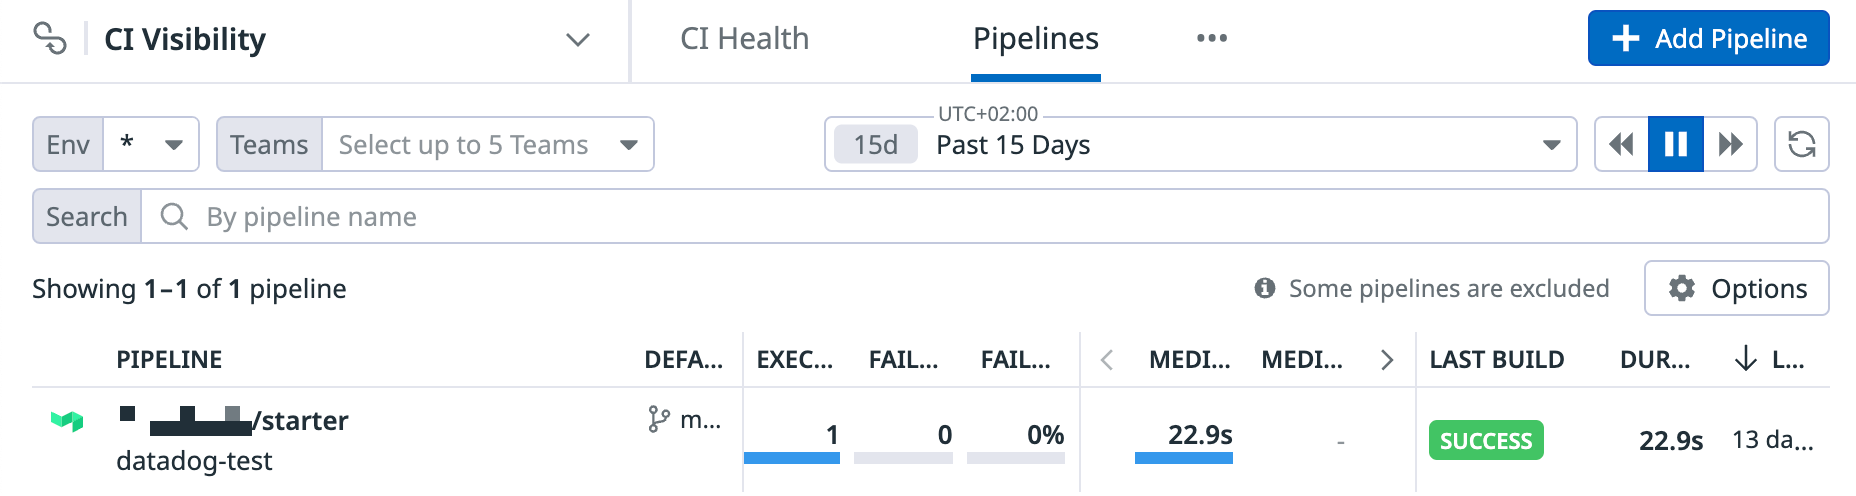
Once Datadog tracing has been configured on your Buildkite pipeline and its builds have been completed, then in the CI Pipeline Visibility interface, navigate to the CI Pipeline List and Executions pages to see the CI Pipeline Visibility interface populated with data.
Note that the CI Pipeline List page in CI Pipeline Visibility displays data for only the default branch of each repository.
Additional resources
Learn more about:
Datadog integration with Buildkite in the Set up Tracing on a Buildkite Pipeline guide of Datadog's documentation.
Overall best CI/CD practices involving the use of Datadog's APM tracing and CI Pipeline Visibility integration, from the CI/CD best practices blog post.
Getting agent fleet metrics (queue depth, agent counts) into Datadog using StatsD and DogStatsD, from the monitoring and observability best practices.
CI Pipeline Visibility is maintained by Datadog. Therefore, for any questions or feature requests about this product, contact Datadog Support.