Tracing in the Buildkite agent
Distributed tracing tools like Datadog APM or OpenTelemetry tracing allow you to gain more insight into the performance of your CI runs - what's fast, what's slow, what could be optimized, and more importantly, how these things are changing over time.
The Buildkite agent currently supports the two tracing backends listed above, Datadog APM (using OpenTracing) and OpenTelemetry. This doc will guide you through setting up tracing using either of these backends.
Using Datadog APM
If you are looking to use Datadog's Application Performance Monitoring (APM) tracing with a Buildkite agent, Using Datadog APM section of Buildkite Pipelines' Datadog integration documentation.
Using OpenTelemetry tracing
Before starting the Buildkite agent, install and configure an OpenTelemetry Collector. Learn more about this from OpenTelemetry's Install the Collector page of their documentation.
Once the Collector is up and running, start the Buildkite agent with:
buildkite-agent start --tracing-backend opentelemetry
This will enable OpenTelemetry tracing, and start sending traces to an OpenTelemetry Collector.
The Buildkite agent's OpenTelemetry implementation uses the OTLP gRPC exporter to export trace information. This means that there must be a Collector capable of ingesting OTLP gRPC traces accessible by the Buildkite agent. By default, the Buildkite agent will export trace information to https://localhost:4317, but this can be overridden by passing in an environment variable OTEL_EXPORTER_OTLP_ENDPOINT containing an updated endpoint for the Collector when the agent is started.
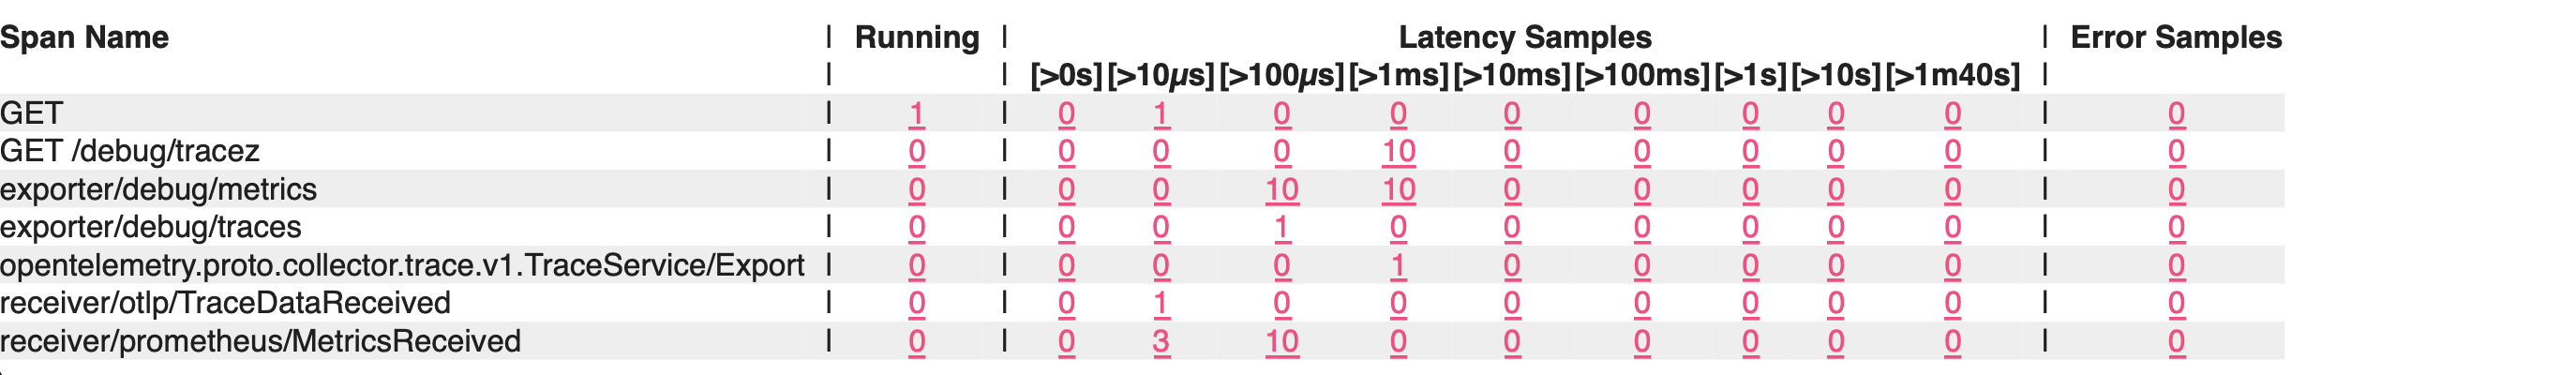
Once traces are being sent, you can view the internal state of the collector by visiting the TraceZ debug interface:
http://localhost:55679/debug/tracez
This interface shows active and sampled spans and is helpful for troubleshooting your OpenTelemetry trace pipeline.
The Buildkite agent defaults to the grpc transport for OpenTelemetry, but can overridden using the OTEL_EXPORTER_OTLP_PROTOCOL environment variable to http/protobuf on v3.101.0 or later versions of the Buildkite agent.
To set the OpenTelemetry service name, provide the --tracing-service-name example-buildkite-agent. The default service name when not specified is buildkite-agent.
If using the OpenTelemetry Tracing Notification Service, you can provide the --tracing-propagate-traceparent flag to propagate traces from the Buildkite control plane, and through to your Agent trace spans.
Learn more about configuring the OpenTelemetry integration with Buildkite Pipelines from the OpenTelemetry integrations page.
Trace context propagation
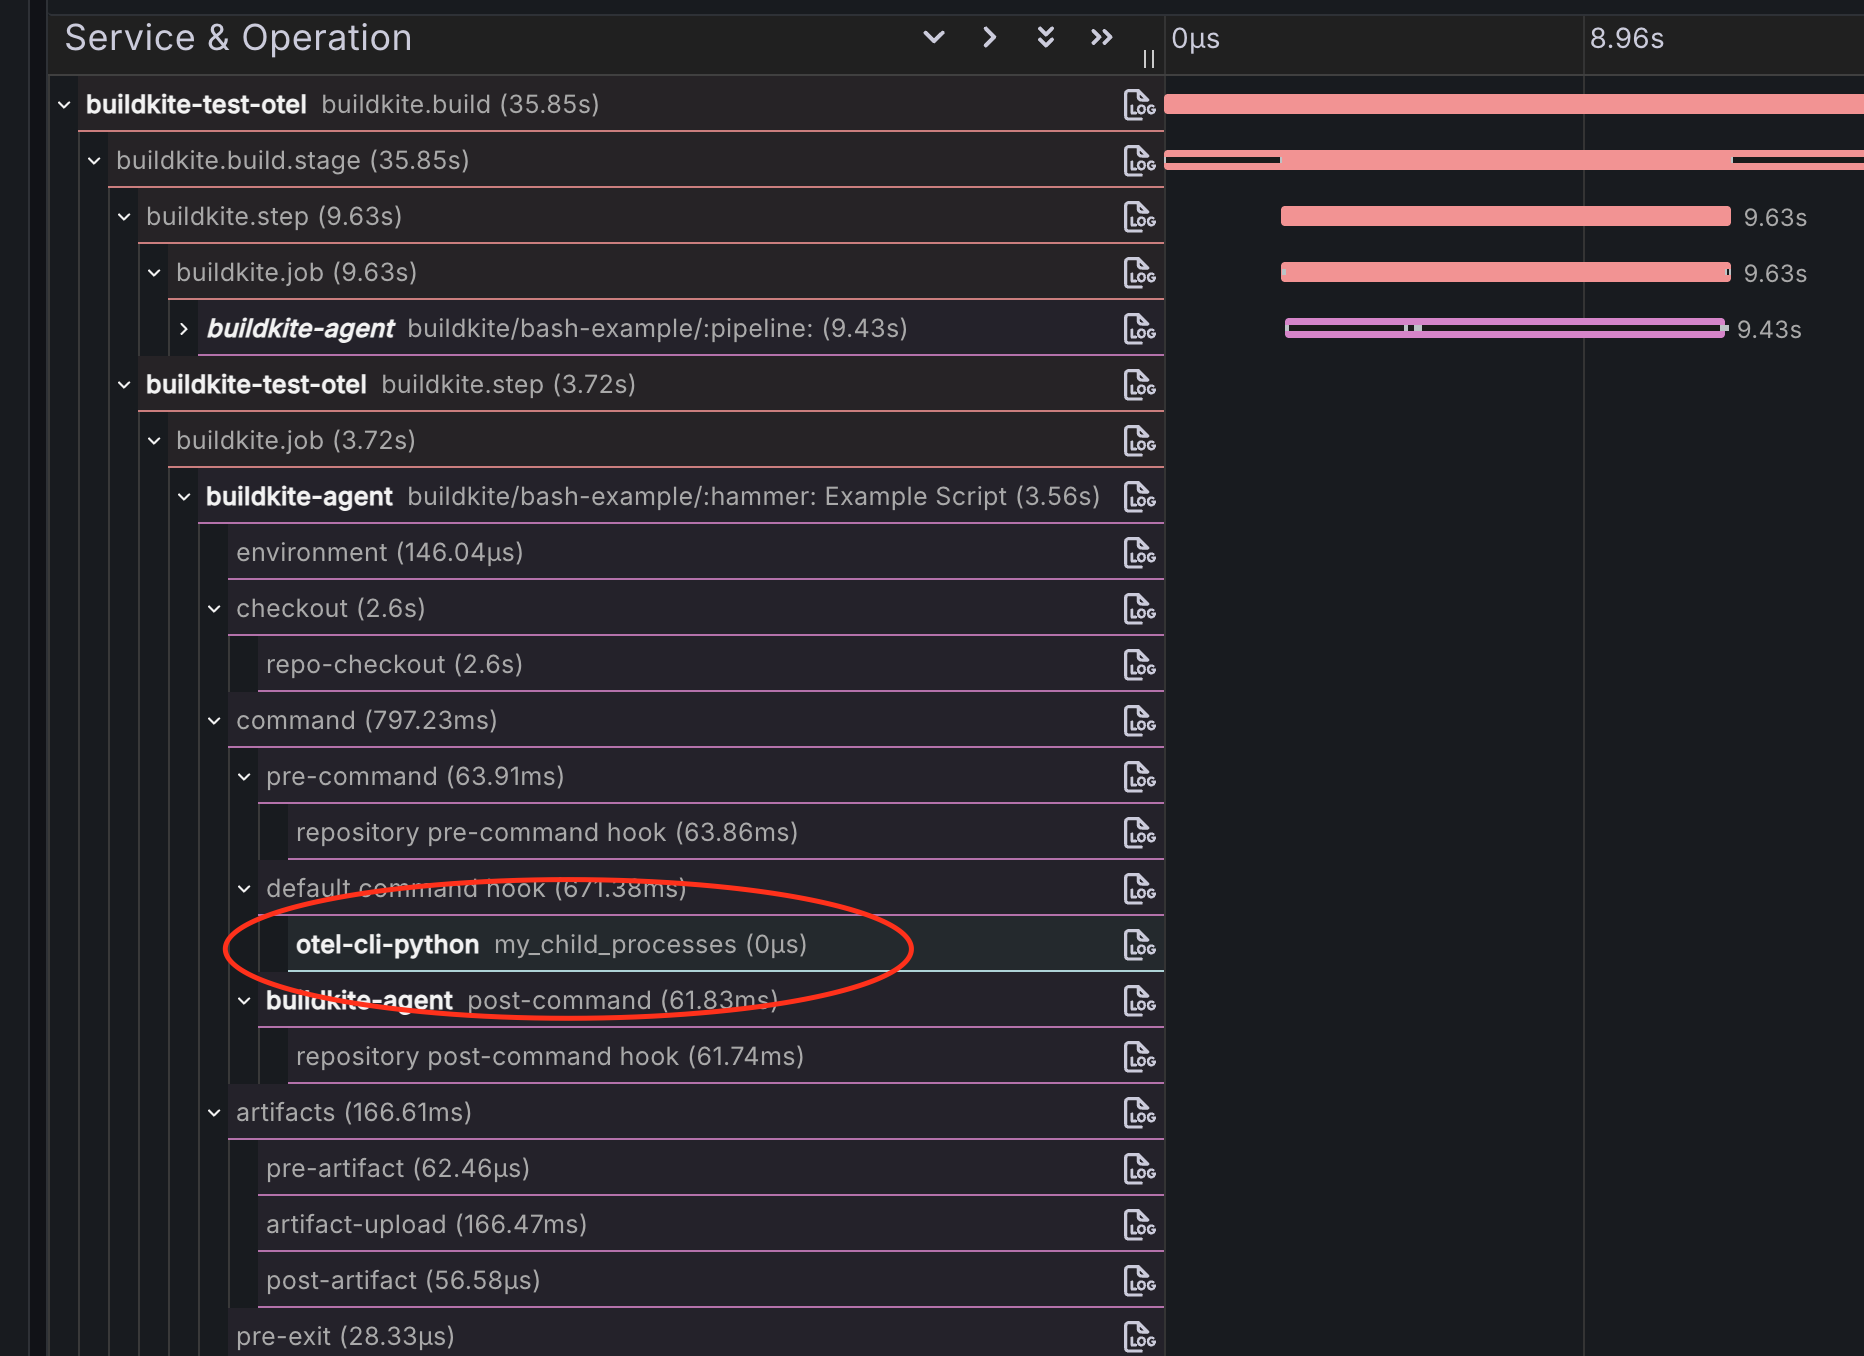
Starting from Buildkite agent version v3.100, when a Buildkite agent executes a command (build script, hook, plugin, and so on), the current trace context is automatically propagated to the child process using environment variables. This enables distributed tracing across job boundaries, and your build scripts can continue the trace started by the agent or the Buildkite Pipelines backend.
The agent serializes the trace context into multiple formats for compatibility with various tracing libraries:
| Environment Variable | Format |
|---|---|
| TRACEPARENT, TRACESTATE | W3C Trace Context |
| UBER_TRACE_ID | Jaeger |
| X_B3_TRACEID, X_B3_SPANID, X_B3_SAMPLED | Zipkin B3 |
| X_AMZN_TRACE_ID | AWS X-Ray |
The environment variable names follow the OpenTelemetry Environment Variable Carriers specification.
To continue the trace in your build script, configure your tracing library to extract context from the environment variables. For example, with the OpenTelemetry SDK, you can read the TRACEPARENT variable and create a child span that links back to the agent's span.
Sending OpenTelemetry traces to Honeycomb
To send traces to Honeycomb, in addition to starting the Buildkite agent with the --tracing-backend opentelemetry option, you also need to add the following environment variables. The API token provided by Honeycomb will need to be replaced in the OTEL_EXPORTER_OTLP_HEADERS below.
# this is the same as --tracing-backend opentelemetry
export BUILDKITE_TRACING_BACKEND="opentelemetry"
# service name is configurable
export OTEL_SERVICE_NAME="buildkite-agent"
# the agent only supports GRPC transport
export OTEL_EXPORTER_OTLP_PROTOCOL="grpc"
# the GRPC transport requires a port to be specified in the URL
export OTEL_EXPORTER_OTLP_ENDPOINT="https://api.honeycomb.io:443"
# authentication of traces is done via the API key in this header
export OTEL_EXPORTER_OTLP_HEADERS="x-honeycomb-team=xxxxx"