
Queue metrics in clusters
The details page for a queue shows current agent capacity, job demand, and dispatch wait times. Anyone who can view the queue can use these metrics and job investigation tools. Use them to operate an agent fleet and investigate why jobs are or are not running. The current metrics refresh every 15 seconds.
Queue metrics and Queue Insights
This page describes the metrics and job investigation tools on the details page for one queue. These tools are separate from the Queue Insights dashboard, which provides historical metrics across queue and cluster scopes.
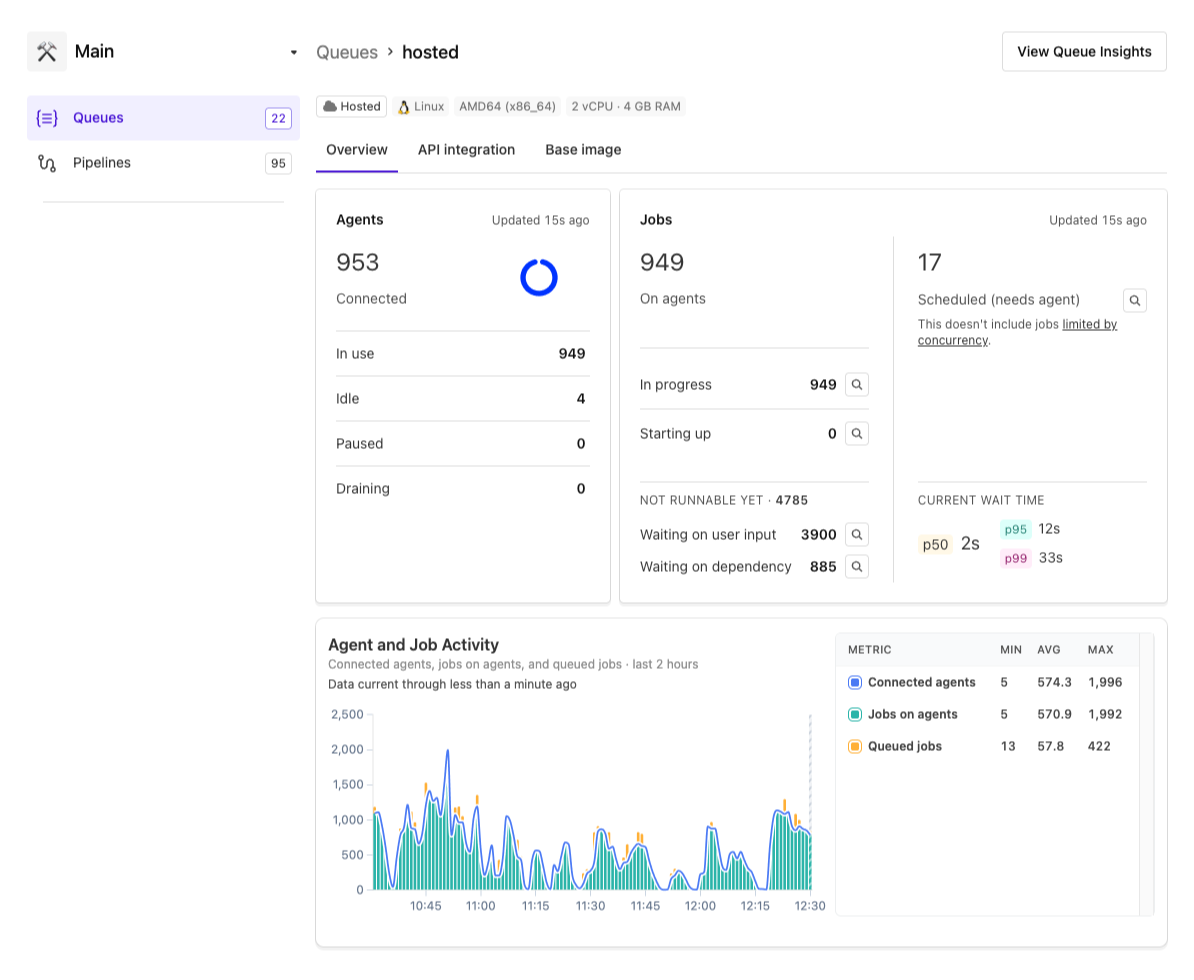
Metrics panels
Agents panel
Connected is the number of agents currently connected to the queue. This total excludes agents that are stopping. The panel shows the following agent counts:
- In use: Agents currently assigned to a job.
- Idle: Connected agents with no assigned job.
- Paused: Connected agents with dispatch paused.
-
Draining: Agents with the
stoppingconnection state.
The circular chart shows the proportions of connected agents that are in use, idle, or paused. Hover over the chart to open Agent Utilization and view each proportion as a percentage.
Jobs panel
On agents is the number of jobs that are running or in the dispatch handoff to an agent. The panel groups jobs as follows:
-
In progress: Jobs in the
running,canceling, ortiming_outstate. -
Starting up: Jobs in the
accepted,assigned, orreservedstate. -
Not runnable yet: Jobs held by workflow conditions, rather than waiting for agent capacity.
-
Waiting on user input: Jobs in the
blockedstate. -
Waiting on dependency: Jobs in the
waitingstate.
-
Waiting on user input: Jobs in the
-
Scheduled (needs agent): Jobs in the
scheduledstate. This count excludes jobs limited by concurrency.
Current wait time
Current wait time shows the p50, p95, and p99 dispatch wait-time percentiles for current scheduled and starting jobs. Wait time begins when a job becomes runnable.
Investigate active jobs
Select the magnifying glass next to In progress, Starting up, Waiting on user input, Waiting on dependency, or Scheduled (needs agent) to load a sample of matching active jobs below the metrics. The queue details page does not load these jobs until you select a metric.
The sample lists each job's state, the time since its relevant state transition, priority, assigned agent, and agent query rules. It also links to the job, pipeline, build, and agent when applicable.
Samples are limited as follows:
- Scheduled (needs agent): The first 25 jobs in dispatch order.
- In progress and Starting up: Up to 25 jobs for each state. Use the state filters above the list to narrow the sample.
- Waiting on user input and Waiting on dependency: Up to 25 jobs.
Select Open in GraphQL Explorer to continue the investigation with a query for the selected queue, job states, and job types. You can edit the query to retrieve more fields or paginate beyond the page sample.
Agent and job activity
Agent and Job Activity shows the last two hours for the following metrics:
- Connected agents: Agents connected to the queue.
- Jobs on agents: Jobs in progress.
- Queued jobs: Jobs scheduled or in the dispatch handoff to an agent.
Use this queue-level activity chart to identify patterns in how fleet capacity responds to job demand and evaluate the efficiency of your scaling rules. Each data point represents a snapshot at the end of a minute.
When a metric has no data for an individual minute, the chart keeps the remaining data visible and shows a gap for the unavailable data point. Hovering over the affected minute shows a Data unavailable tooltip.
A freshness indicator above the chart shows one of the following:
- Data current through: A timestamp shows the most recent successful update reflected in the chart.
- Some data points unavailable: One or more metric data points in the chart aren't available.
- Data delayed · last update received: The queue's data hasn't updated recently. A timestamp shows the last update.