See what's happening inside your tests with test traces
We're super excited to announce that OpenTelemetry tracing is no longer reserved for application monitoring.
Today, Buildkite has released tracing for your test suite, allowing you to take a peek inside your tests and uncover where your time and money (compute) are being wasted.
To get started with your coding agent, open your project and paste this prompt:
Enable OpenTelemetry test tracing for this repo in Buildkite Test Engine:
https://buildkite.com/docs/pipelines/configure/tests/test-collection/opentelemetry

Inspect our test framework and CI, then follow the setup guide. Send results
and child spans without duplicate uploads. Prefer OIDC and keep secrets out
of code. Ask for missing suite details and show how to verify a small test run.
With tracing enabled on your test suite, Buildkite will aggregate the spans and find the most costly or duplicated fixtures and give your agents the data they need to quickly remediate any problematic tests.
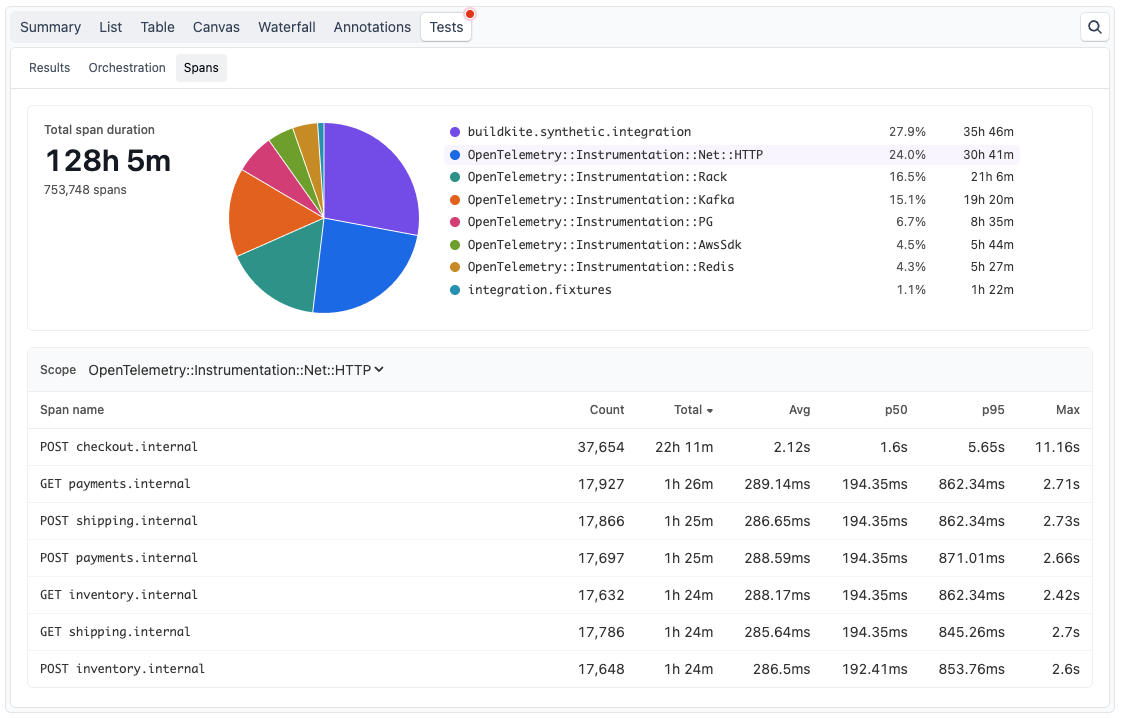
Aggregated spans across a build.
Fine grained data can pinpoint exactly what's causing slow tests and this data is accessible via the UI and our agentic interfaces Buildkite's MCP and API.
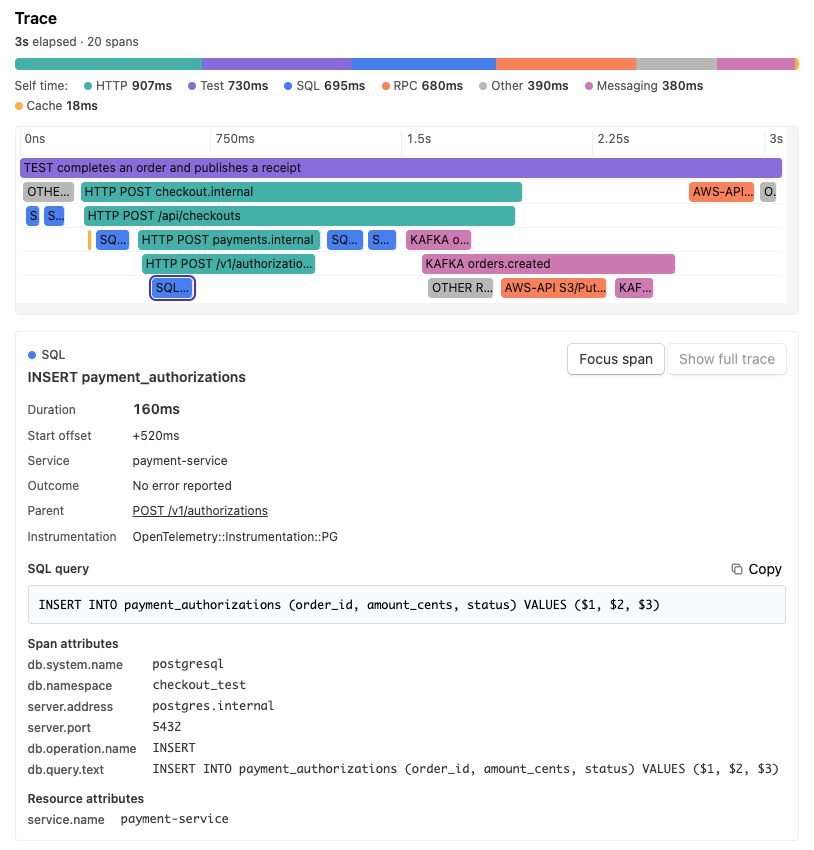
Today we currently support Javascript, Pytest, RSpec and Swift. To get started, checkout our OpenTelemetry test collection guide.
This feature is available on our latest Pro plan with a 10GB/month inclusion and overages charged at $0.50USD per GB of ingested data. Enterprise customers please reach out to your Technical Account Manager if you would like to explore this capability.
James
You deserve better CI.
Get started for free with a full month of our all-access trial.