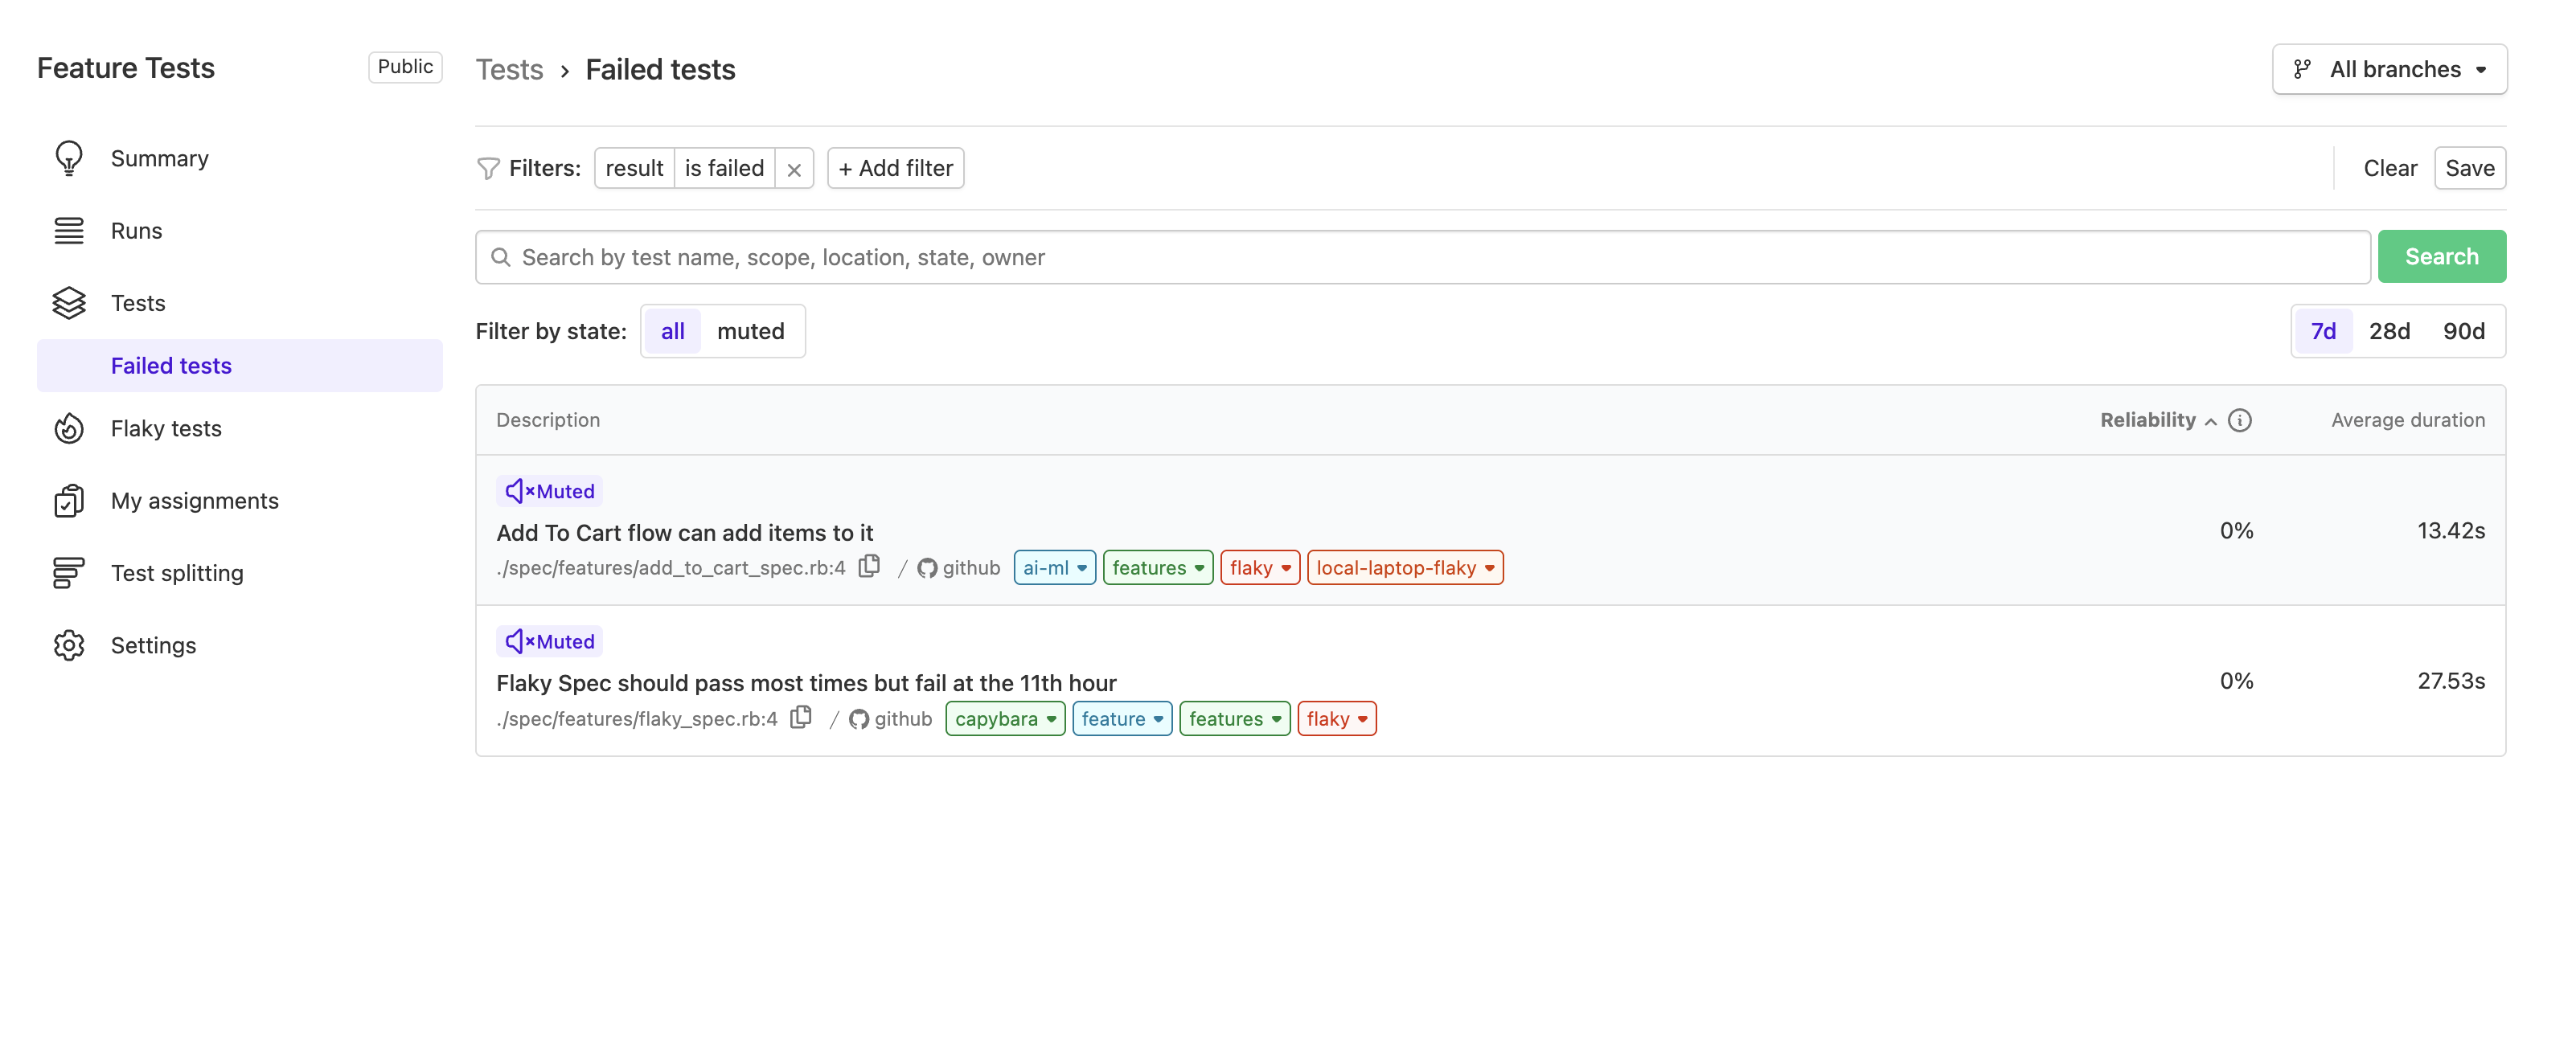
Saved filters in Test Engine
You can now save your favorite test filters in Test Engine for quick access.
The new filter bar in the test list lets you add filters using execution tags and test labels. Once you've set up a view you like, click Save to name it. Your saved filters will then appear as a view in your suite navigation for easy access.
Meghan
Introducing Portals: Authenticated endpoints for GraphQL operations
Buildkite Portals are user-defined GraphQL operations exposed via authenticated URL endpoints — offering a new, secure way to access the Buildkite API.
Designed with machine-to-machine operations in mind, Portals are not tied to user-owned access tokens. Instead, they use ephemeral, scoped tokens that can only perform the operations defined in an approved GraphQL document.
Key benefits of Portals include:
- Scoped access — Tokens are restricted to the exact operations defined by organization admins. This enables fine-grained, least-privilege access to your Buildkite data.
- Ephemeral tokens — Tokens are short-lived and single-purpose, ideal for secure machine-to-machine communication.
- User-invoked flow — Optional interactive flows allow users to generate tokens on-demand, similar to OAuth.
- Userless authentication — Tokens are not tied to any individual user, avoiding disruptions if team members are removed.
Getting started with Portals
Portals can be created by administrators from organization settings page. Each portal is assigned a unique endpoint with the following URL structure: https://portal.buildkite.com/organizations/{organization.slug}/portals/{portal.slug}
Portals support passing variables to enable dynamic operations and offer multiple authentication mechanisms for flexibility and security.
For more information, see the Portals documentation.
Himal
Python support for test splitting and auto-quarantining 🚀
Buildkite Test Engine now supports test splitting (smart bin packing for faster CI) and auto-quarantining (automatic detection and isolation of failing tests) for Python PyTest suites.
- ✅ Cut down your critical path time.
- ✅ Keep flaky tests from blocking your pipeline.
- ✅ Spend less time on manual triage.
To get started, install the Test Engine Client to:
- Automatically split tests evenly across parallel jobs.
- Quarantine unstable tests based on customizable heuristics.
For full setup instructions, see the Test Engine docs.
Ming
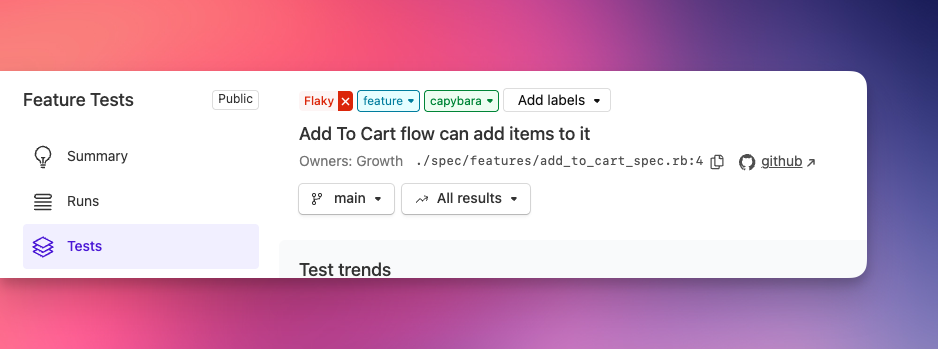
Label your tests with Test Engine
You can now label your tests with Buildkite Test Engine!
Labels allow you to:
- Organize tests to be more meaningful to your team and organization.
- Categorize tests, and therefore, can be used to filter tests within Test Engine.
Labels may be applied to or removed from tests:
- Manually through the Buildkite interface.
- Automatically through the automatic quarantine or test execution tags features.
- Using the REST API.
Start labelling your tests with Test Engine today.
James
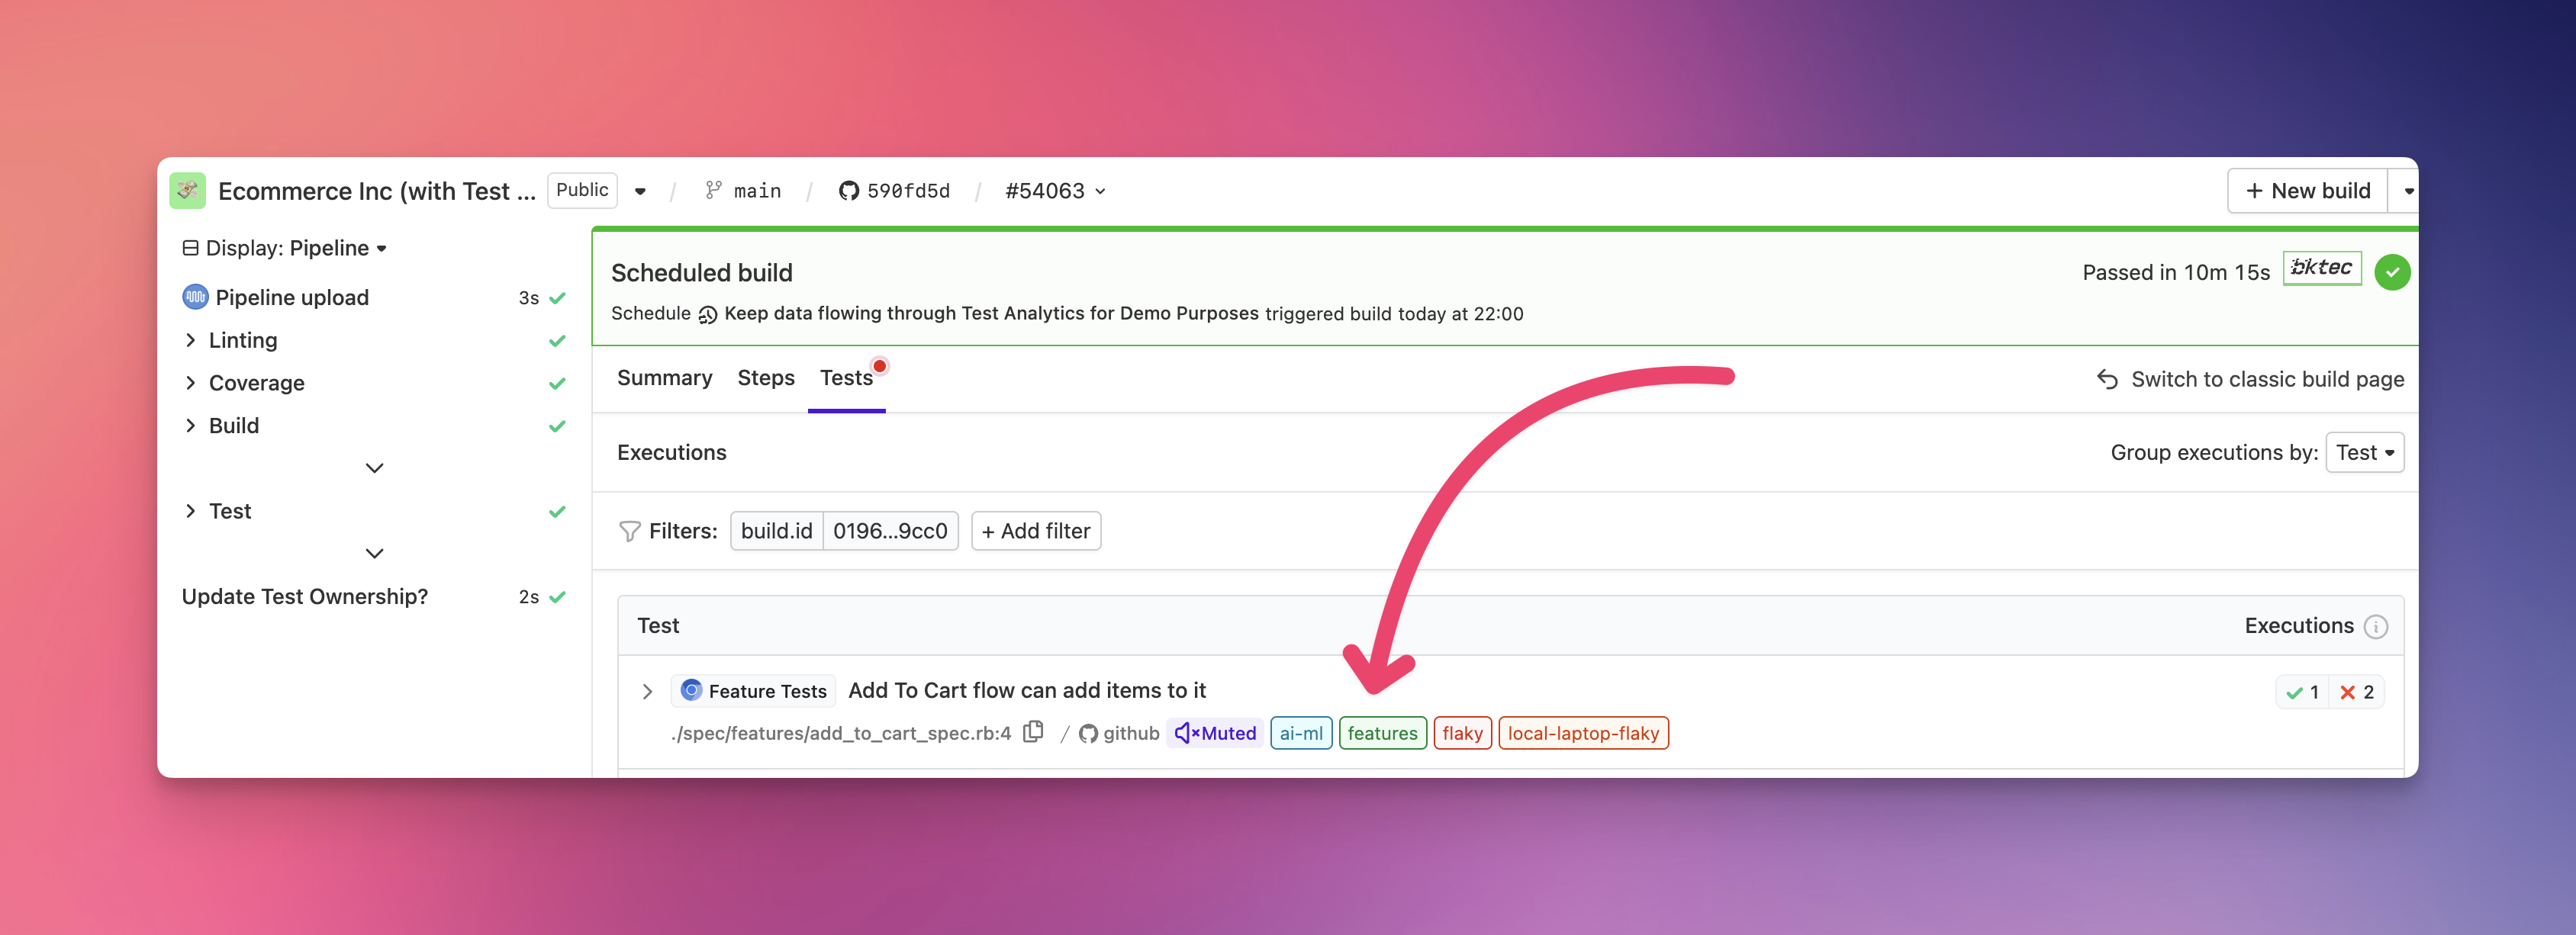
Custom tagging for tests
You can now add custom tags to your tests — unlocking a whole new dimension (literally) of insight and control.
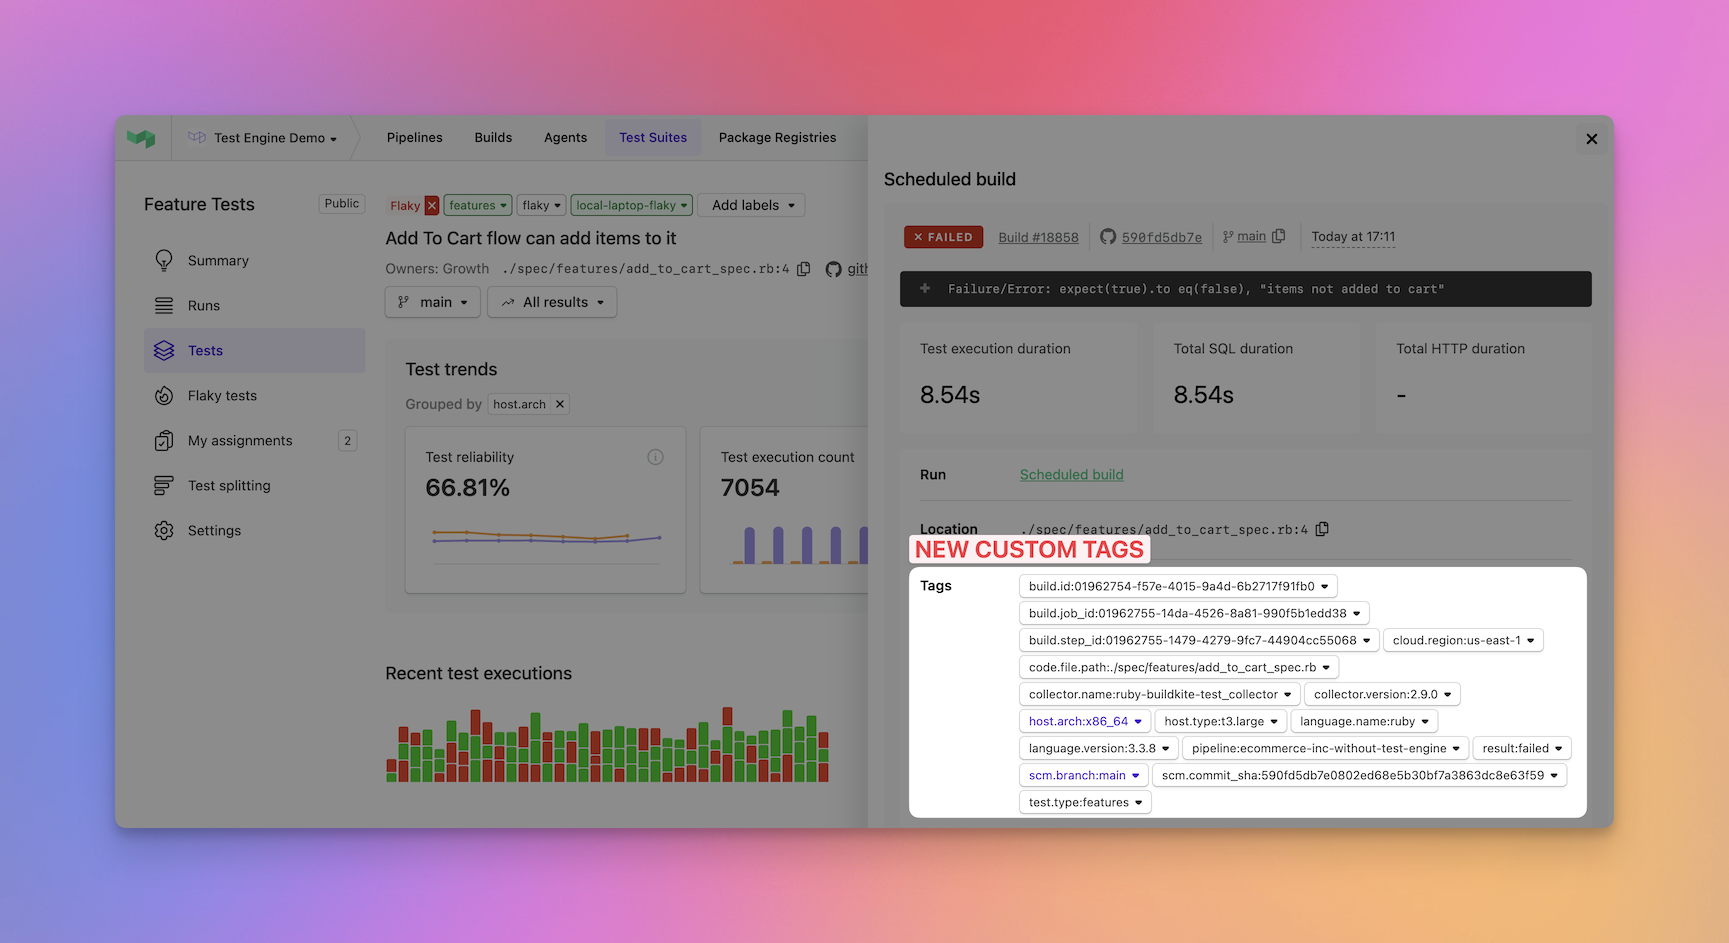
Whether you want to tag tests by the infrastructure they run on, the services they touch, or framework versions they depend on, custom tags let you define what matters — and then slice your test data by those attributes.
🔍 Find root causes faster
Spot patterns in failures and slowdowns by breaking down your suite along your real-world dimensions — like container image, compute pool, or dependency version.
📊 Insights tailored to your stack
Move beyond generic test metrics. Aggregations by custom tags give you visibility into the things that actually cause pain in your CI.
💸 Drive cost and performance optimizations
Use tags to identify high-cost, slow, or flaky tests by environment — and target improvements where they’ll have the biggest impact.
Start tagging your tests with Test Engine today.
James
Buildkite Joins GitHub Secret Scanning Program
Buildkite has joined the the GitHub Secret Scanning Program to enhance security for your API tokens. This program helps detect and alert us when a Buildkite API access token is leaked in a public GitHub repository.
What happens when a token is detected:
- For tokens found in public repositories or npm packages: GitHub immediately notifies Buildkite, and we automatically revoke the affected token to prevent unauthorized access. The token owner and organization admins receive notifications about the incident.
- For tokens found in private repositories with secret scanning enabled: Repository admins and the committer are alerted directly through GitHub's interface, where they can view and manage the detected secrets.
FAQ's
Do I need to enable anything to get this protection?
- For public repositories, protection is automatic with no configuration needed.
- For private repositories, repository administrators need to enable GitHub Secret Scanning.
What types of Buildkite tokens are protected?
- Currently, only Buildkite API access tokens
How will I be notified if my token is revoked?
- The owner of the token and the admins of the associated organization will receive an email from Buildkite.
What should I do if I receive a notification about a leaked token?
- Generate a new access token for your Buildkite user account.
Jason
Pausing and resuming individual agents
It is now possible to pause individual Buildkite agents. Pausing an agent is similar to stopping an agent, but unlike stopping, a paused agent remains running and can resume work later on.
Pausing an agent is a useful alternative to stopping an agent, especially when resources are tied to the lifetime of the agent, such as a cloud instance configured to terminate when the agent exits. By pausing an agent, you can investigate problems in its environment more easily, without the worry of jobs being dispatched to it.
Some examples of maintenance operations that could benefit from pausing an agent include:
- pruning Docker caches
- emptying temporary directories
- updating code mirrors
- installing software updates
- compacting or vacuuming databases
You can pause agents in either the UI, GraphQL API or Rest API. Paused agent counts will be reflected in the platform.
To fully benefit from pausing, we recommend upgrading your agents to the latest released version.
See Pausing and resuming agents on Buildkite Docs for more information.
Josh
GitLab Self-Managed Commit Status Support
Buildkite now supports setting commit statuses on GitLab self-managed instances. This integration enables real-time status visibility in merge requests and can block merging until builds pass.
You can configure commit statuses today from your organization's repository providers page:
https://buildkite.com/organizations/-/repository-providers
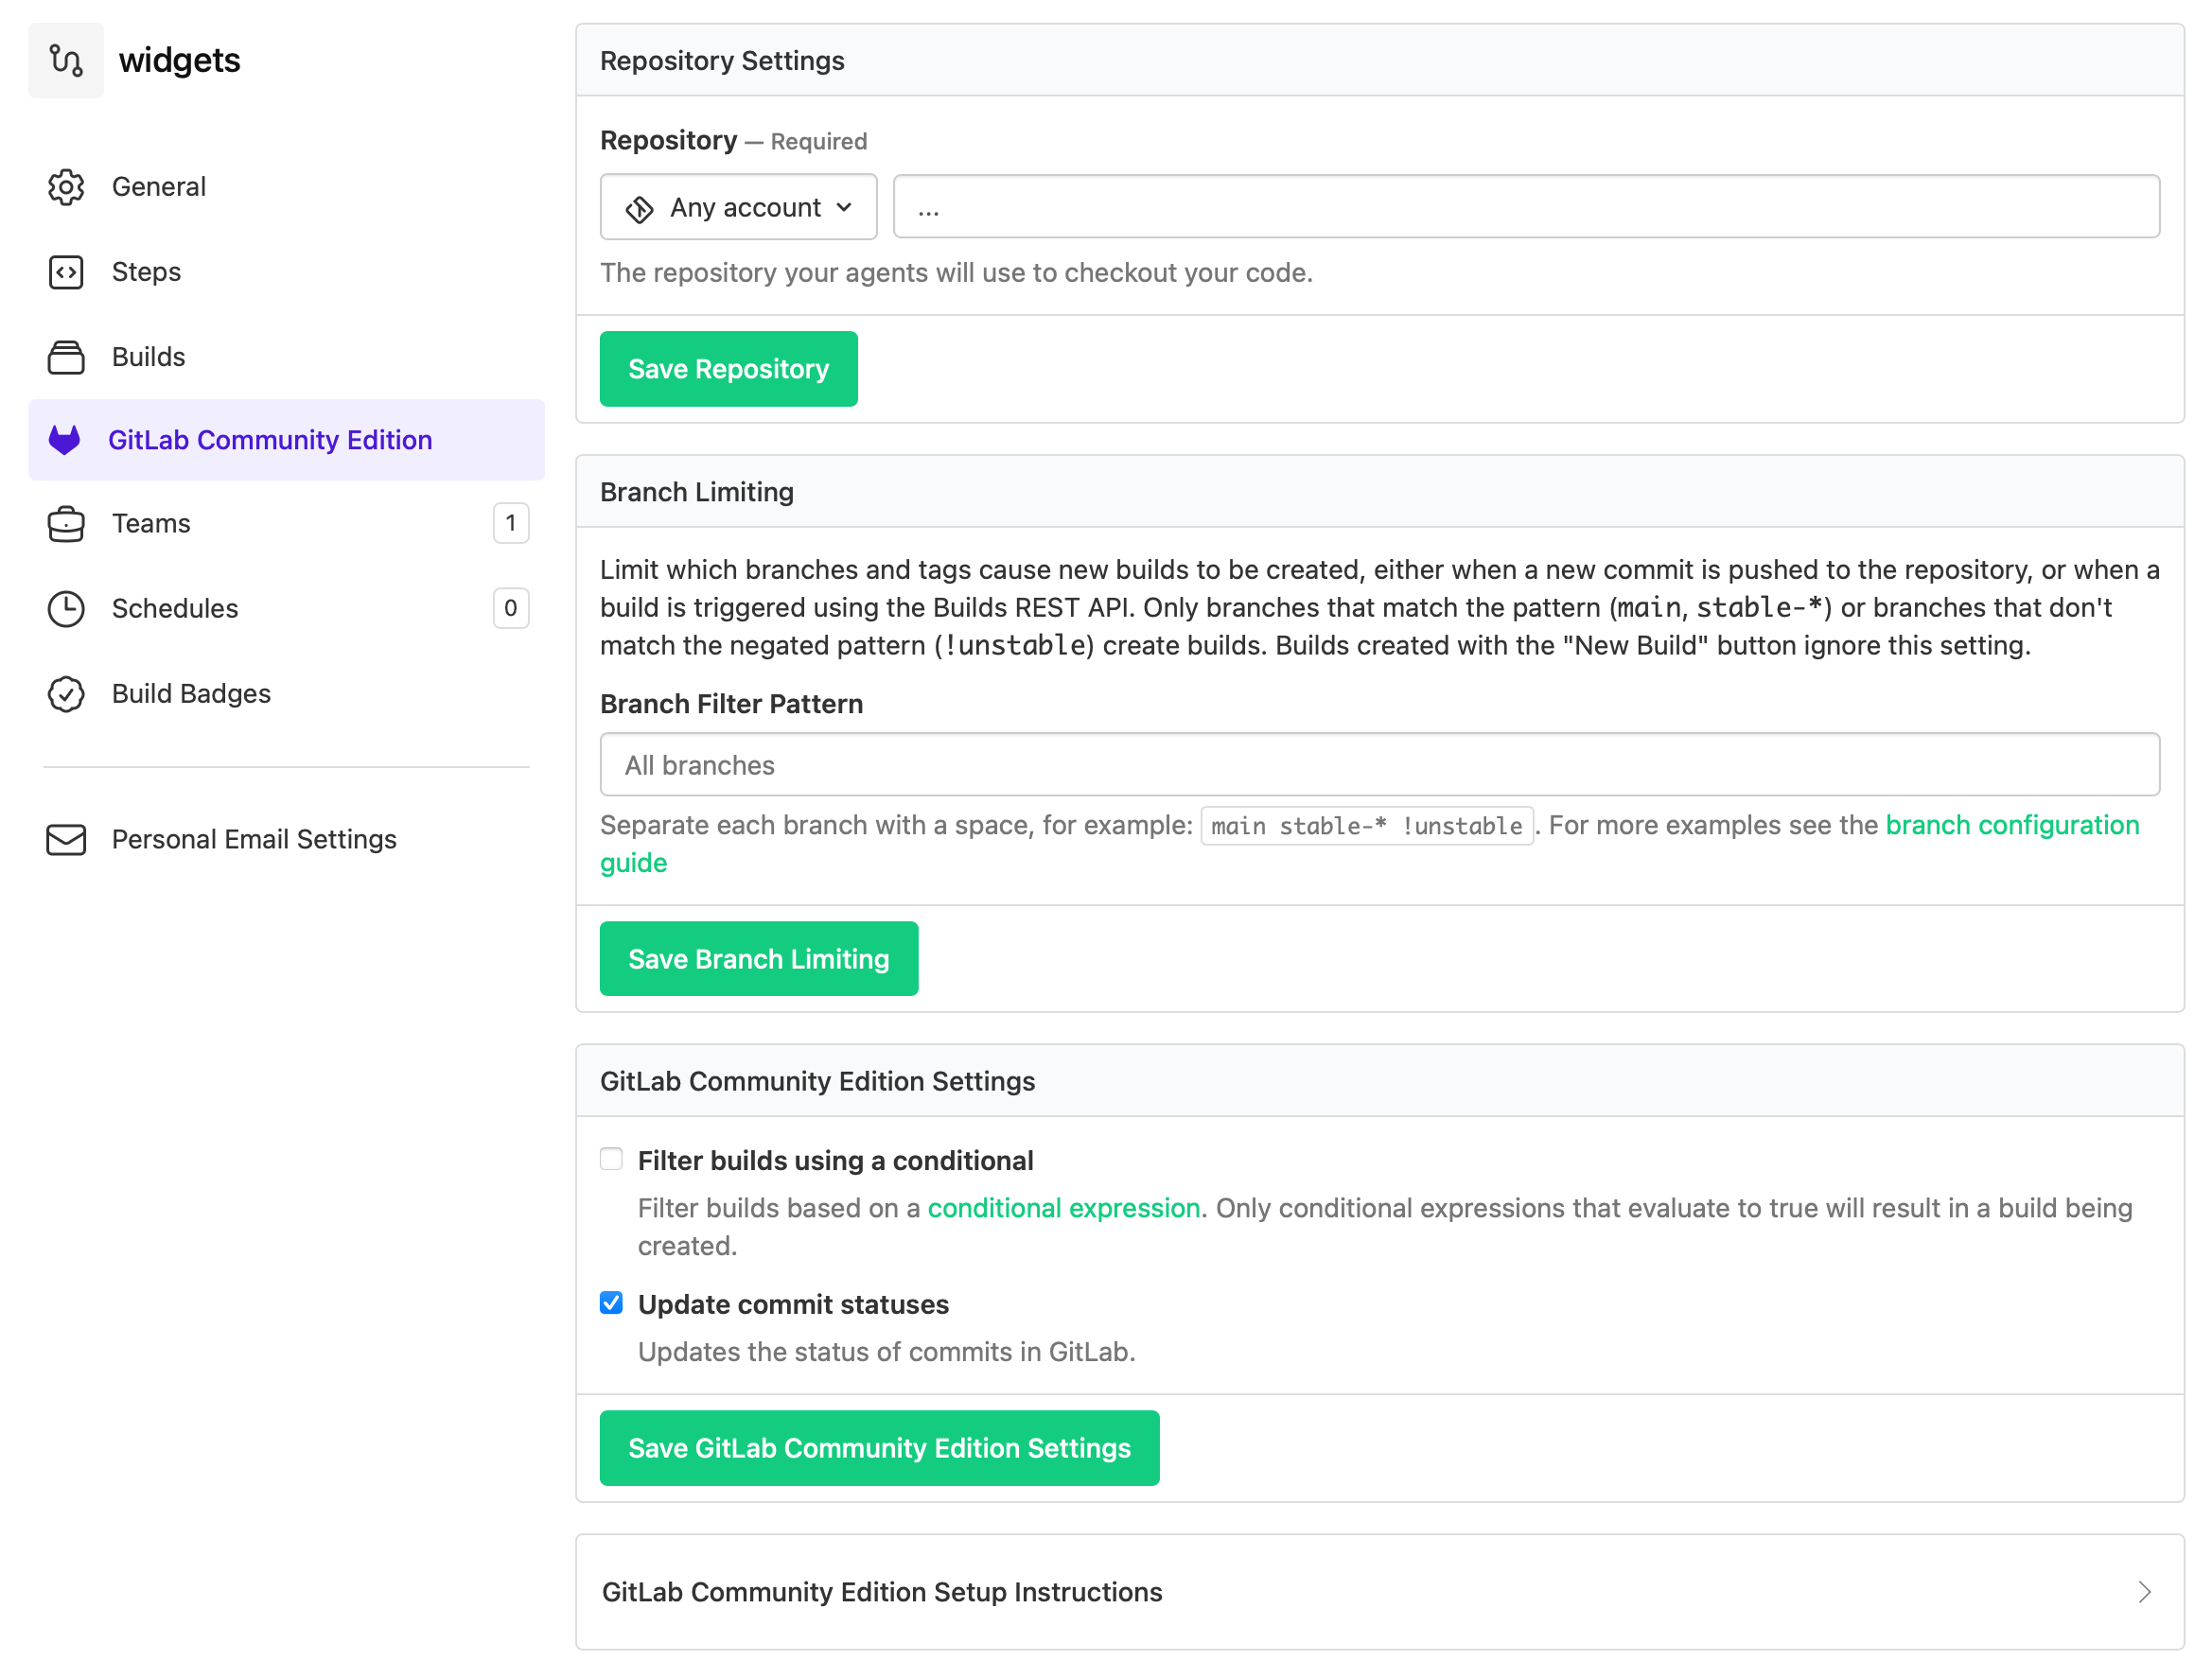
Look under API Settings for configuration instructions:
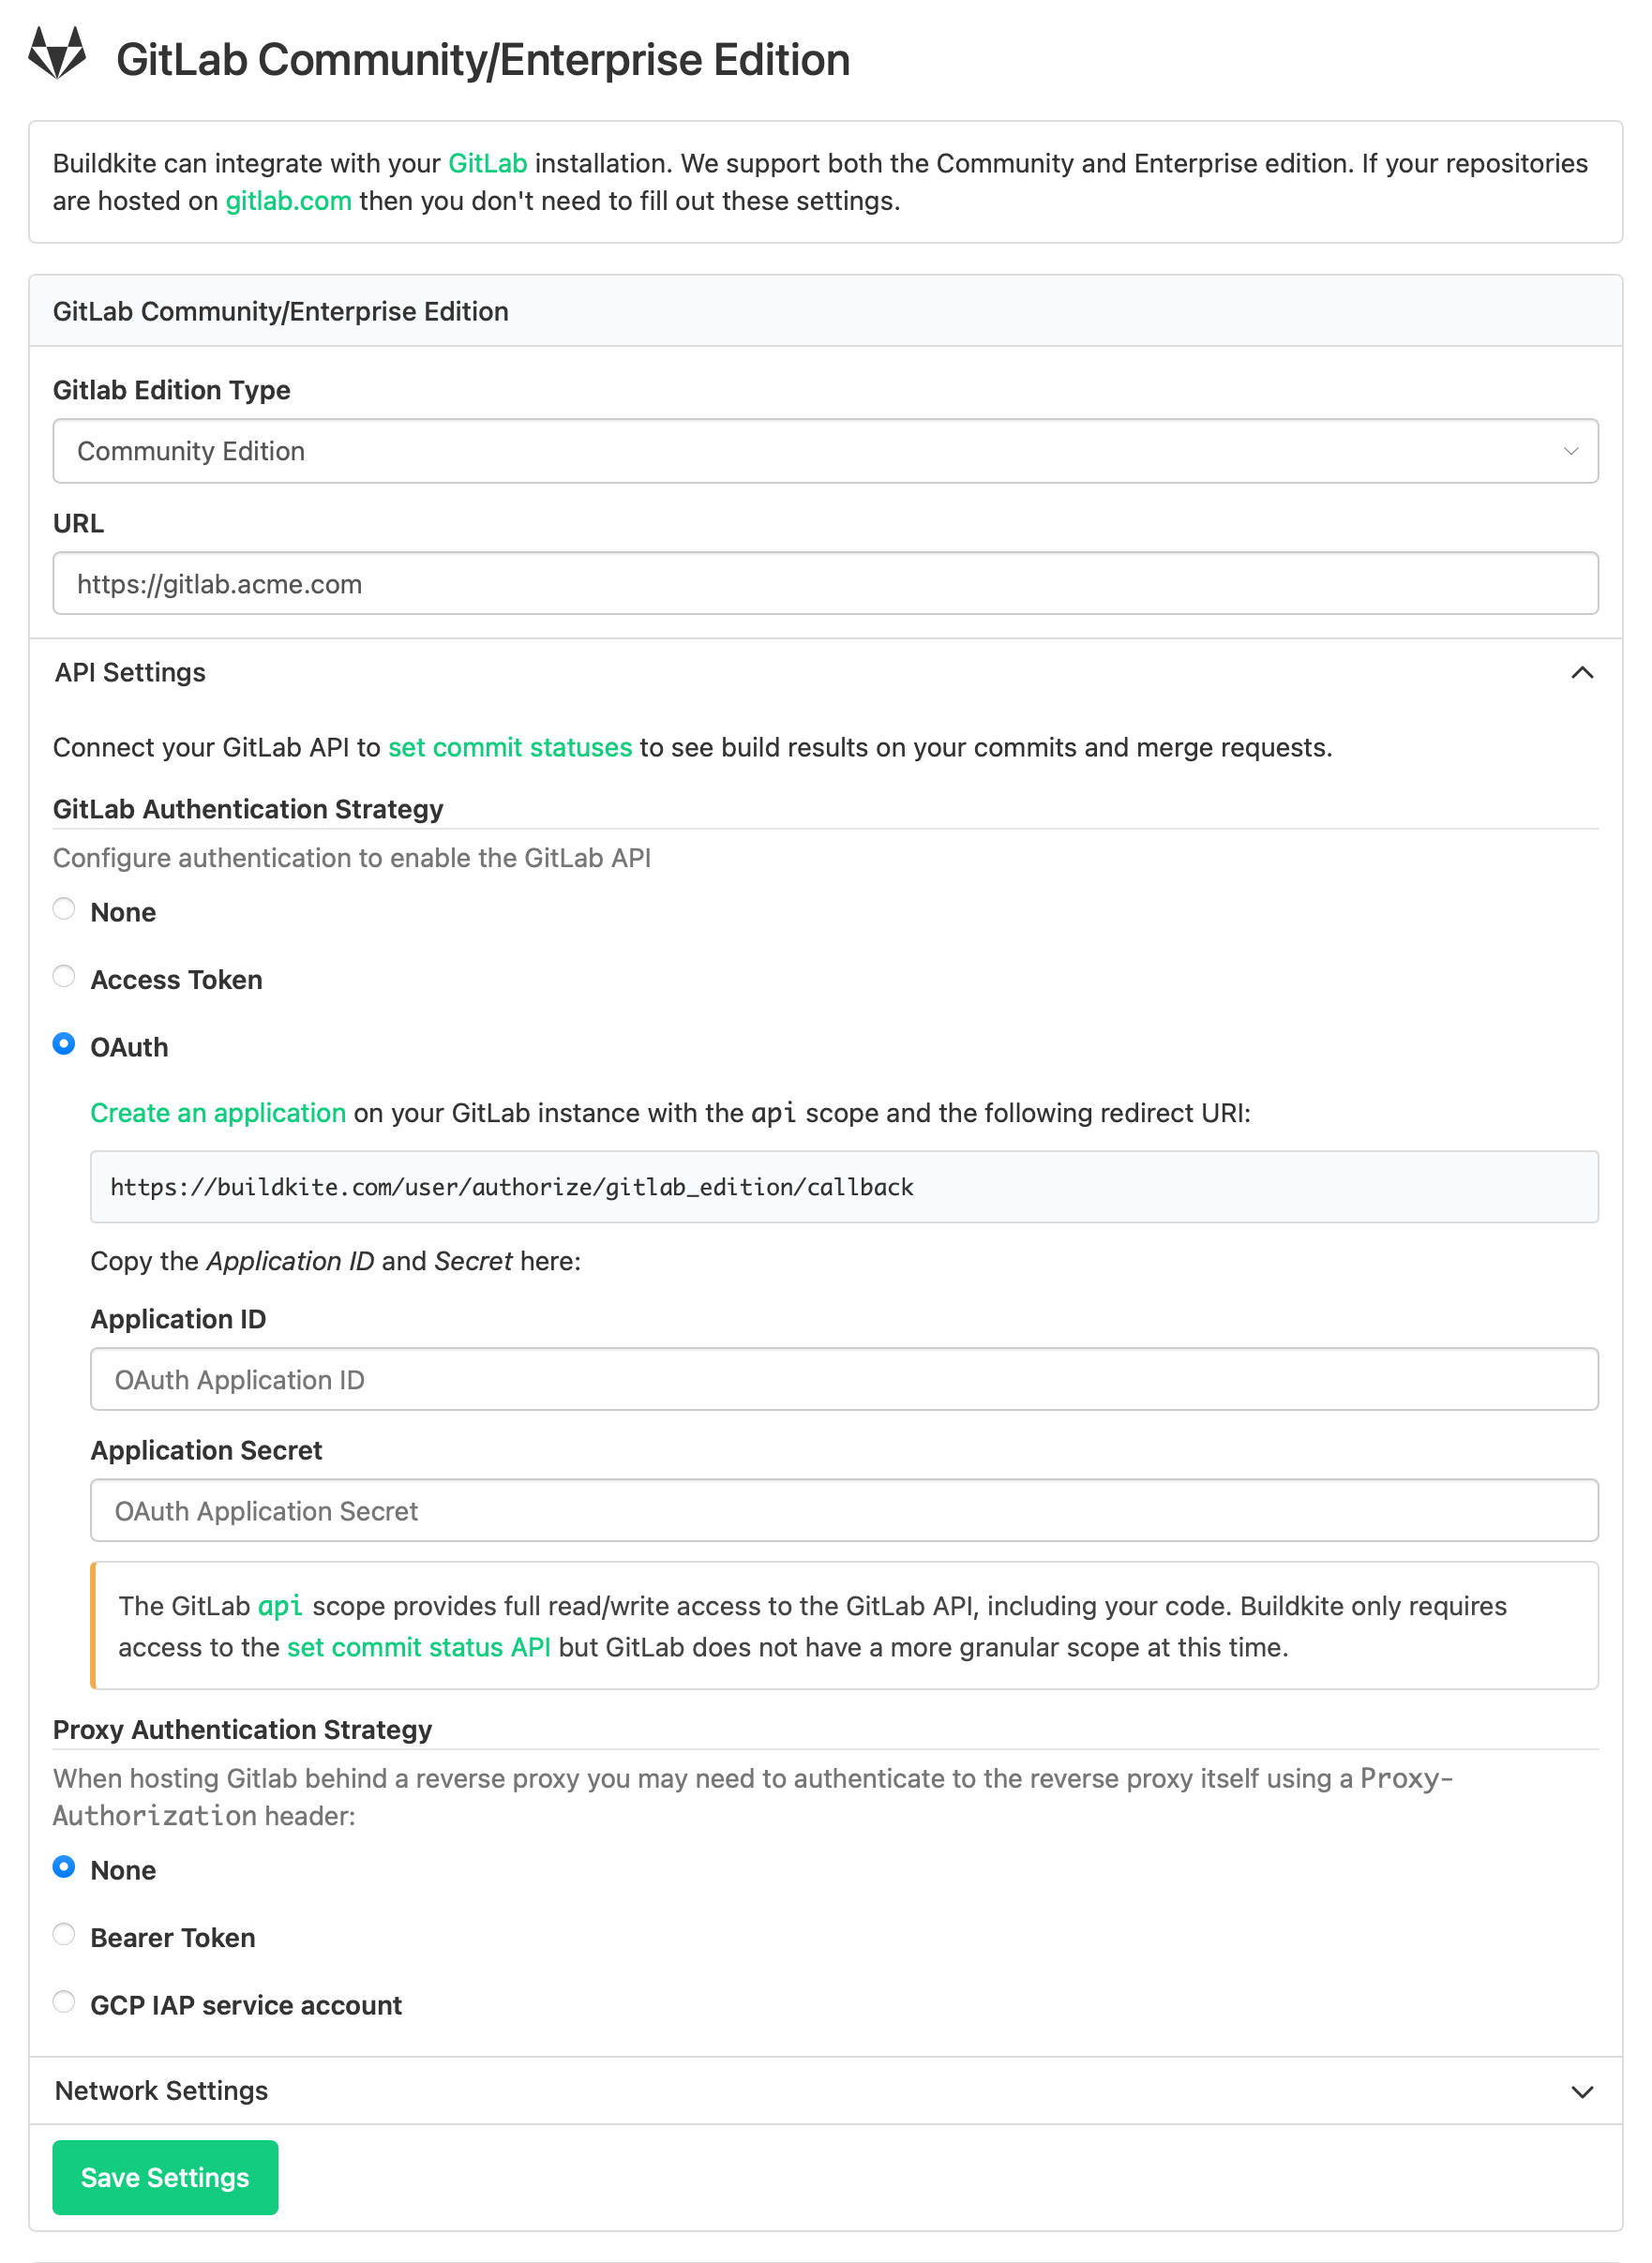
Then go to your favorite pipeline's repository settings page to turn on commit status reporting ✨
Mark
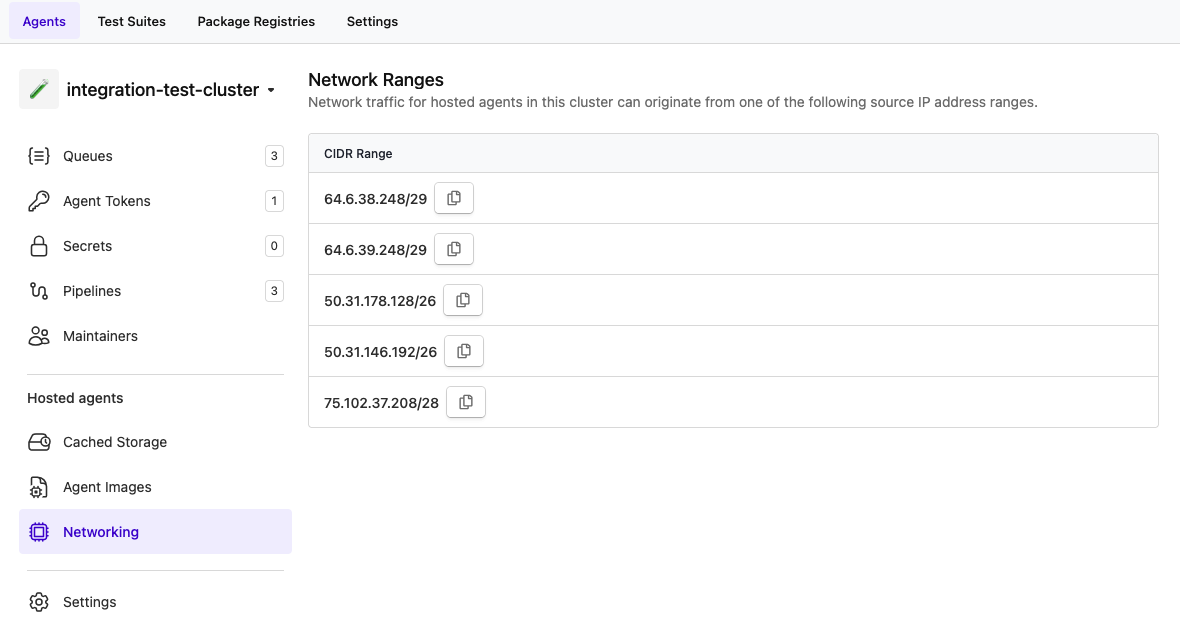
Source IP ranges now displayed in clusters with hosted agents
You can now see the source IP ranges used by your Buildkite hosted agents in your cluster.
Mark
Agent registration tokens can now be set to expire
We're introducing expiry timestamps for agent registration tokens in response to customer feedback around security compliance and token lifecycle management.
You can now set an expiry time when creating tokens via both GraphQL (expiresAt) and REST (expires_at) APIs. The timestamp must be in ISO8601 format (2025-01-01T00:00:00Z).
This change enables automated token rotation through API integration, replacing the previous manual rotation process for long-lived tokens.
Important details:
- Existing tokens will continue to work without expiry
- Expired tokens will prevent new agent registrations but won't affect currently connected agents
- The UI will display tokens as "expired" after their expiry date
- Expiry dates cannot be modified after token creation
- There is no maximum expiry duration but a minimum of 10 minutes in the future is required
Below is a GraphQL example showing the creation of a token with an expiry.
mutation createToken {
  clusterAgentTokenCreate(input: {
    organizationId: "",
    description: "a token with an expiration",
    clusterId:"",
    expiresAt: "2026-01-01T00:00:00Z"
  }) {
    tokenValue
  }
}
Chris
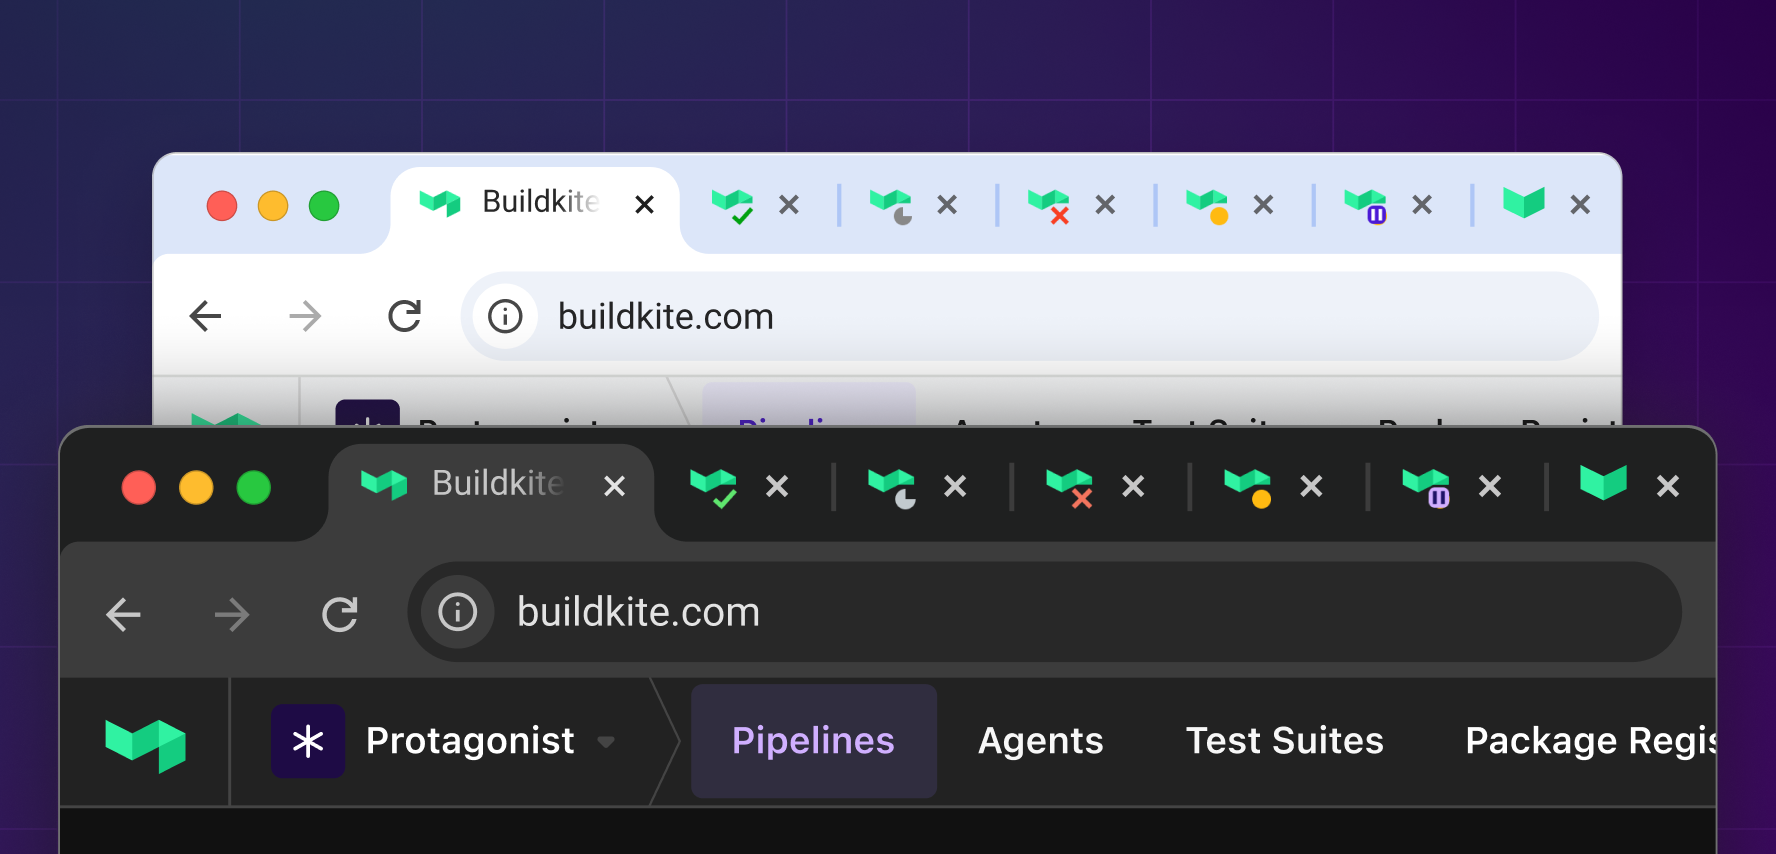
Introducing new Favicons and enhancements
We are happy to announce a small but significant update to our Favicons, bringing a fresh look and improved functionality that enhances your experience with our platform.
Our favicon journey began over a decade ago with the introduction of our vibrant rainbow dynamic Favicons. These icons not only indicated build statuses but also became trusted companions for developers. Since then they’ve gone relatively untouched, so why change now?
There were a few other reasons our rainbow icon suite fell short but overall many of you were experiencing a few things:
- Confusion and trouble with keeping track of multiple tabs with the abrupt color changes
- Falling short of modern accessibility standards, especially for those with visual impairments such as color blindness
- Our core icon was very hard to see with dark theme enabled browsers (dark mode didn’t even exist back when the initial Favicons were created)
- Low resolution and pixelated Favicons on modern monitors
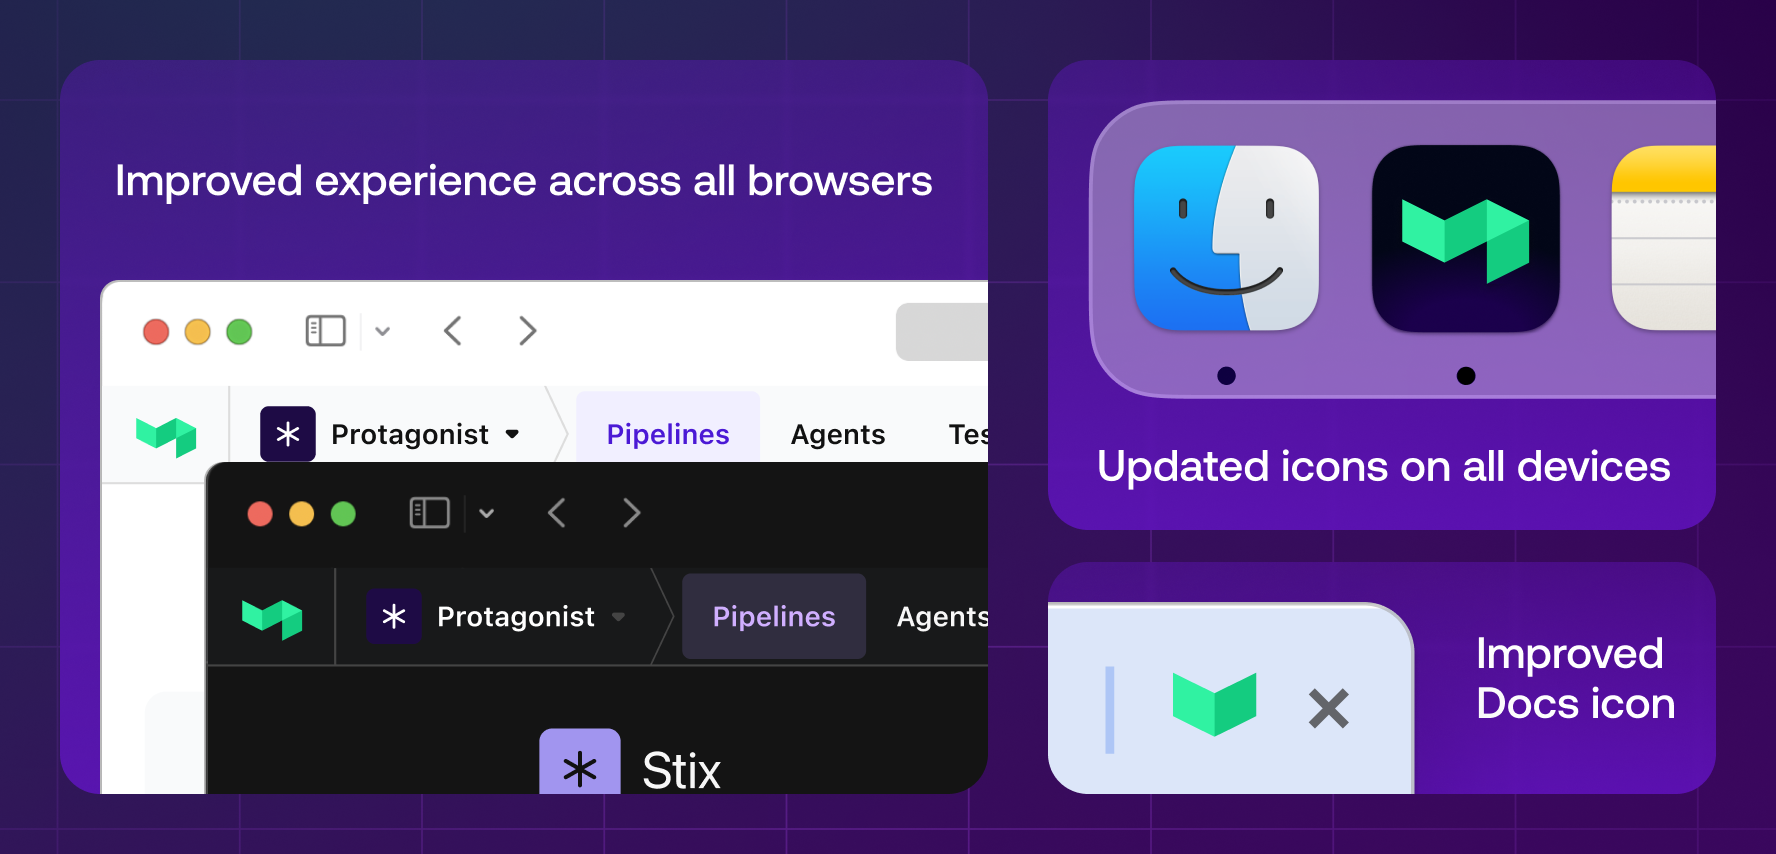
So what’s changed? Here’s a little summary of all the improvements!
Icon-Based Statuses We’ve introduced micro icons for statuses, making it easier to navigate and reducing confusion.
Consistent Favicon Color The core favicon remains the same, ensuring familiarity and visual consistency across multiple tabs.
New Status Variant There’s a new kid in town - pipelines that are blocked now have their own look helping you know when a build requires attention.
Dark Mode Support Our Favicons now look fantastic in dark mode, ensuring visibility and aesthetic appeal across different themes and devices.
Modern Formats and Compatibility SVG and PNG Compatibility: Favicons are now primarily in SVG format for sharp visuals, with PNG fallbacks for older browsers. Also we’ve unlocked bolder and more vibrant colors for those with supported devices by utilizing OKLCH color types.
Additional Improvements
- We’re also introducing a new favicon for our Docs site, making it easily distinguishable from the app.
- Updated pinned and docked icons for better representation across platforms.
- Improved color themes in Safari to match our app more closely.
A lot of you have already noticed the change and we’re absolutely loving how impactful these small changes have been for you. As always, we love to hear your feedback and thoughts, so please let us know what you think at support@buildkite.com.
Corey
Small changes, Big Impact
We’re kicking off 2025 with powerful improvements to make your Buildkite life much easier. Based on your feedback, we’ve shipped several key enhancements that make debugging faster, collaboration smoother, and pipeline management more intuitive 🚀
Better large log viewing experience
We’ve introduced log line grouping and direct linking within the dedicated log interface of the build page. If you're viewing the dedicated log page because your large logs are being truncated in the build page – you now get the same benefits of viewing logs within the build page.
Logs follow group collapsing and allow you to copy URL links to direct log lines, improving the developer experience. This allows for precise debugging and easier collaboration when sharing logs.
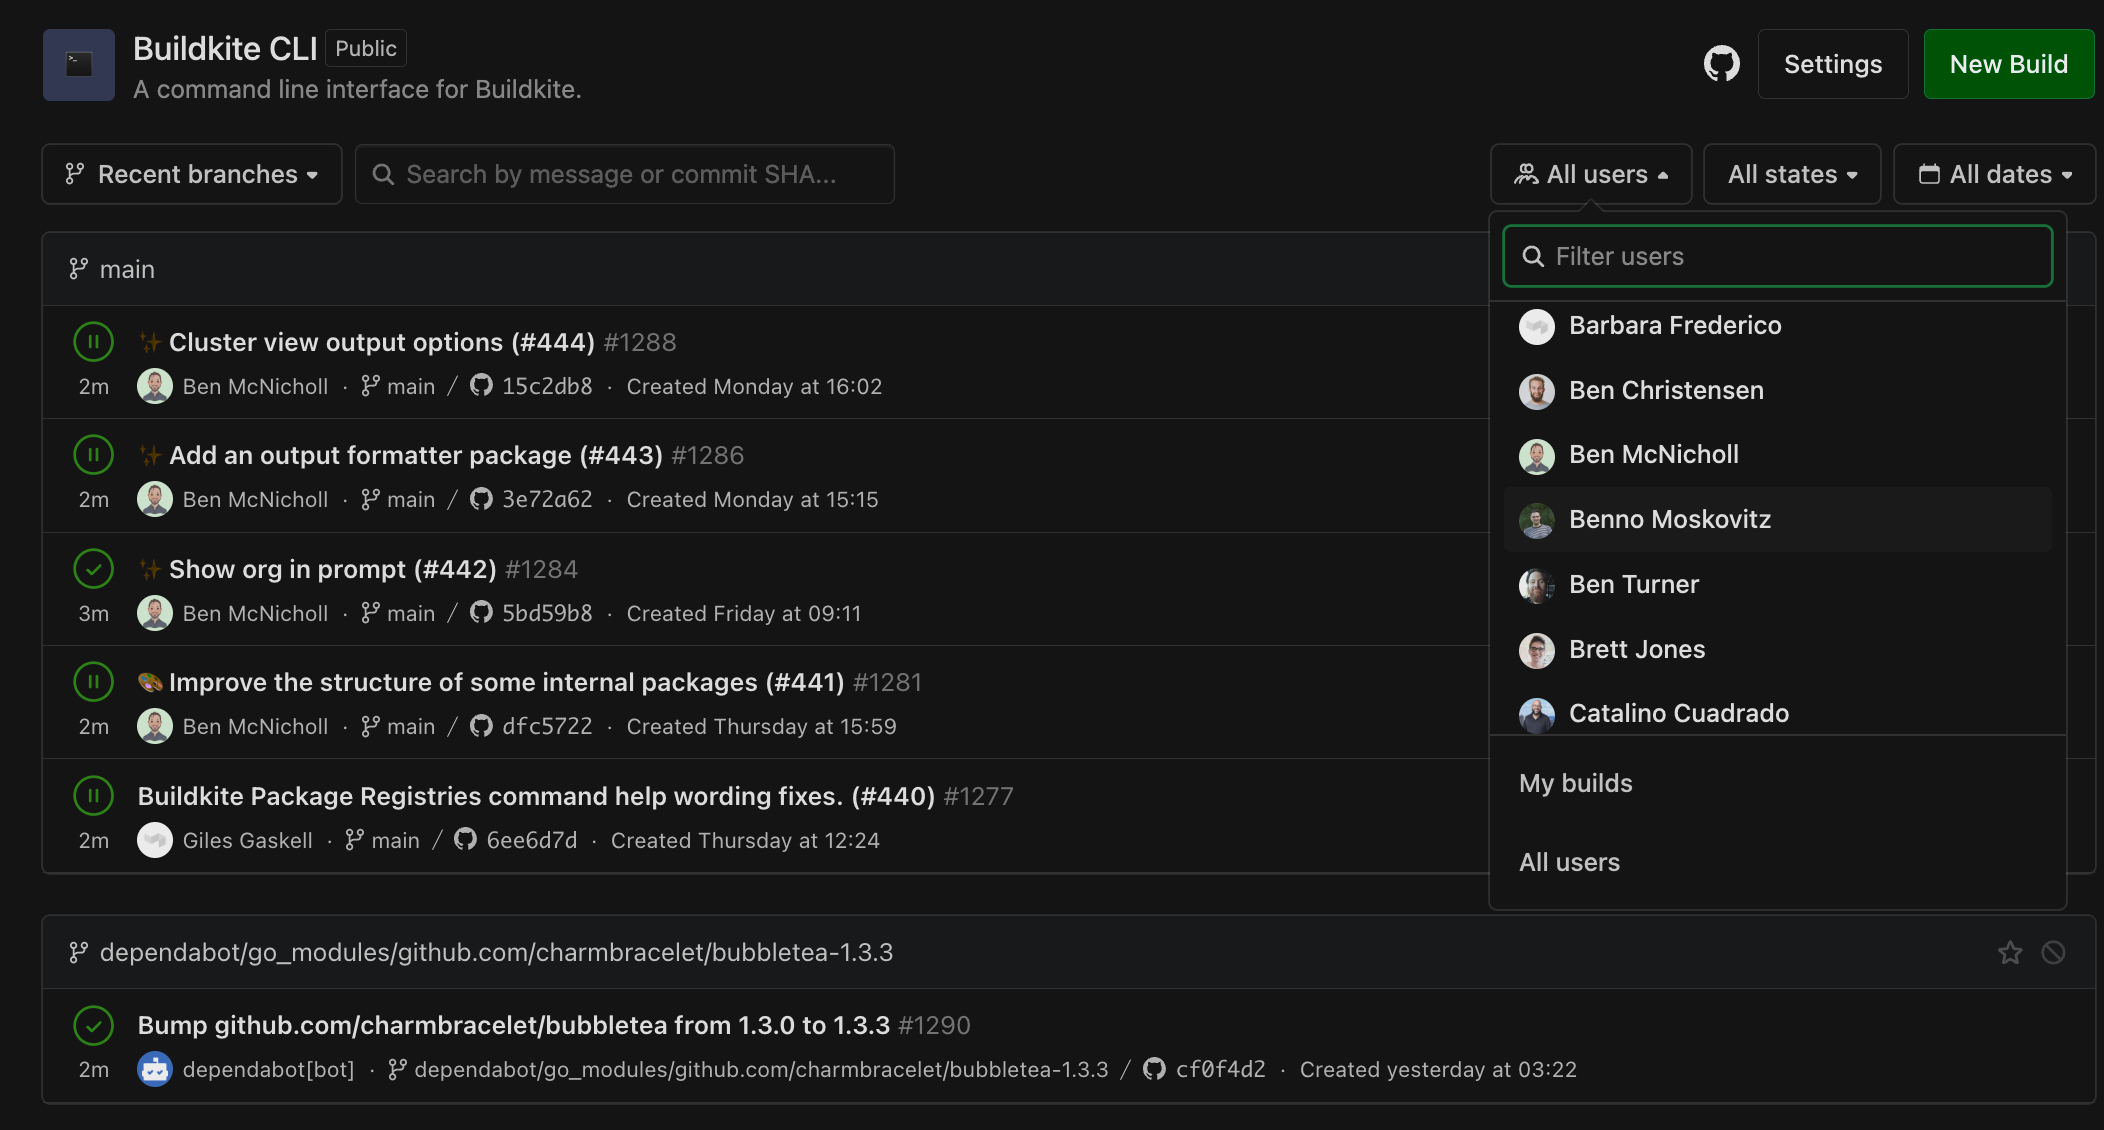
Faster build browsing with user and date filters
We’ve added additional filtering capabilities on the pipelines build page. You can now filter and search for builds by user and by date. This makes troubleshooting and locating colleagues' builds much easier.
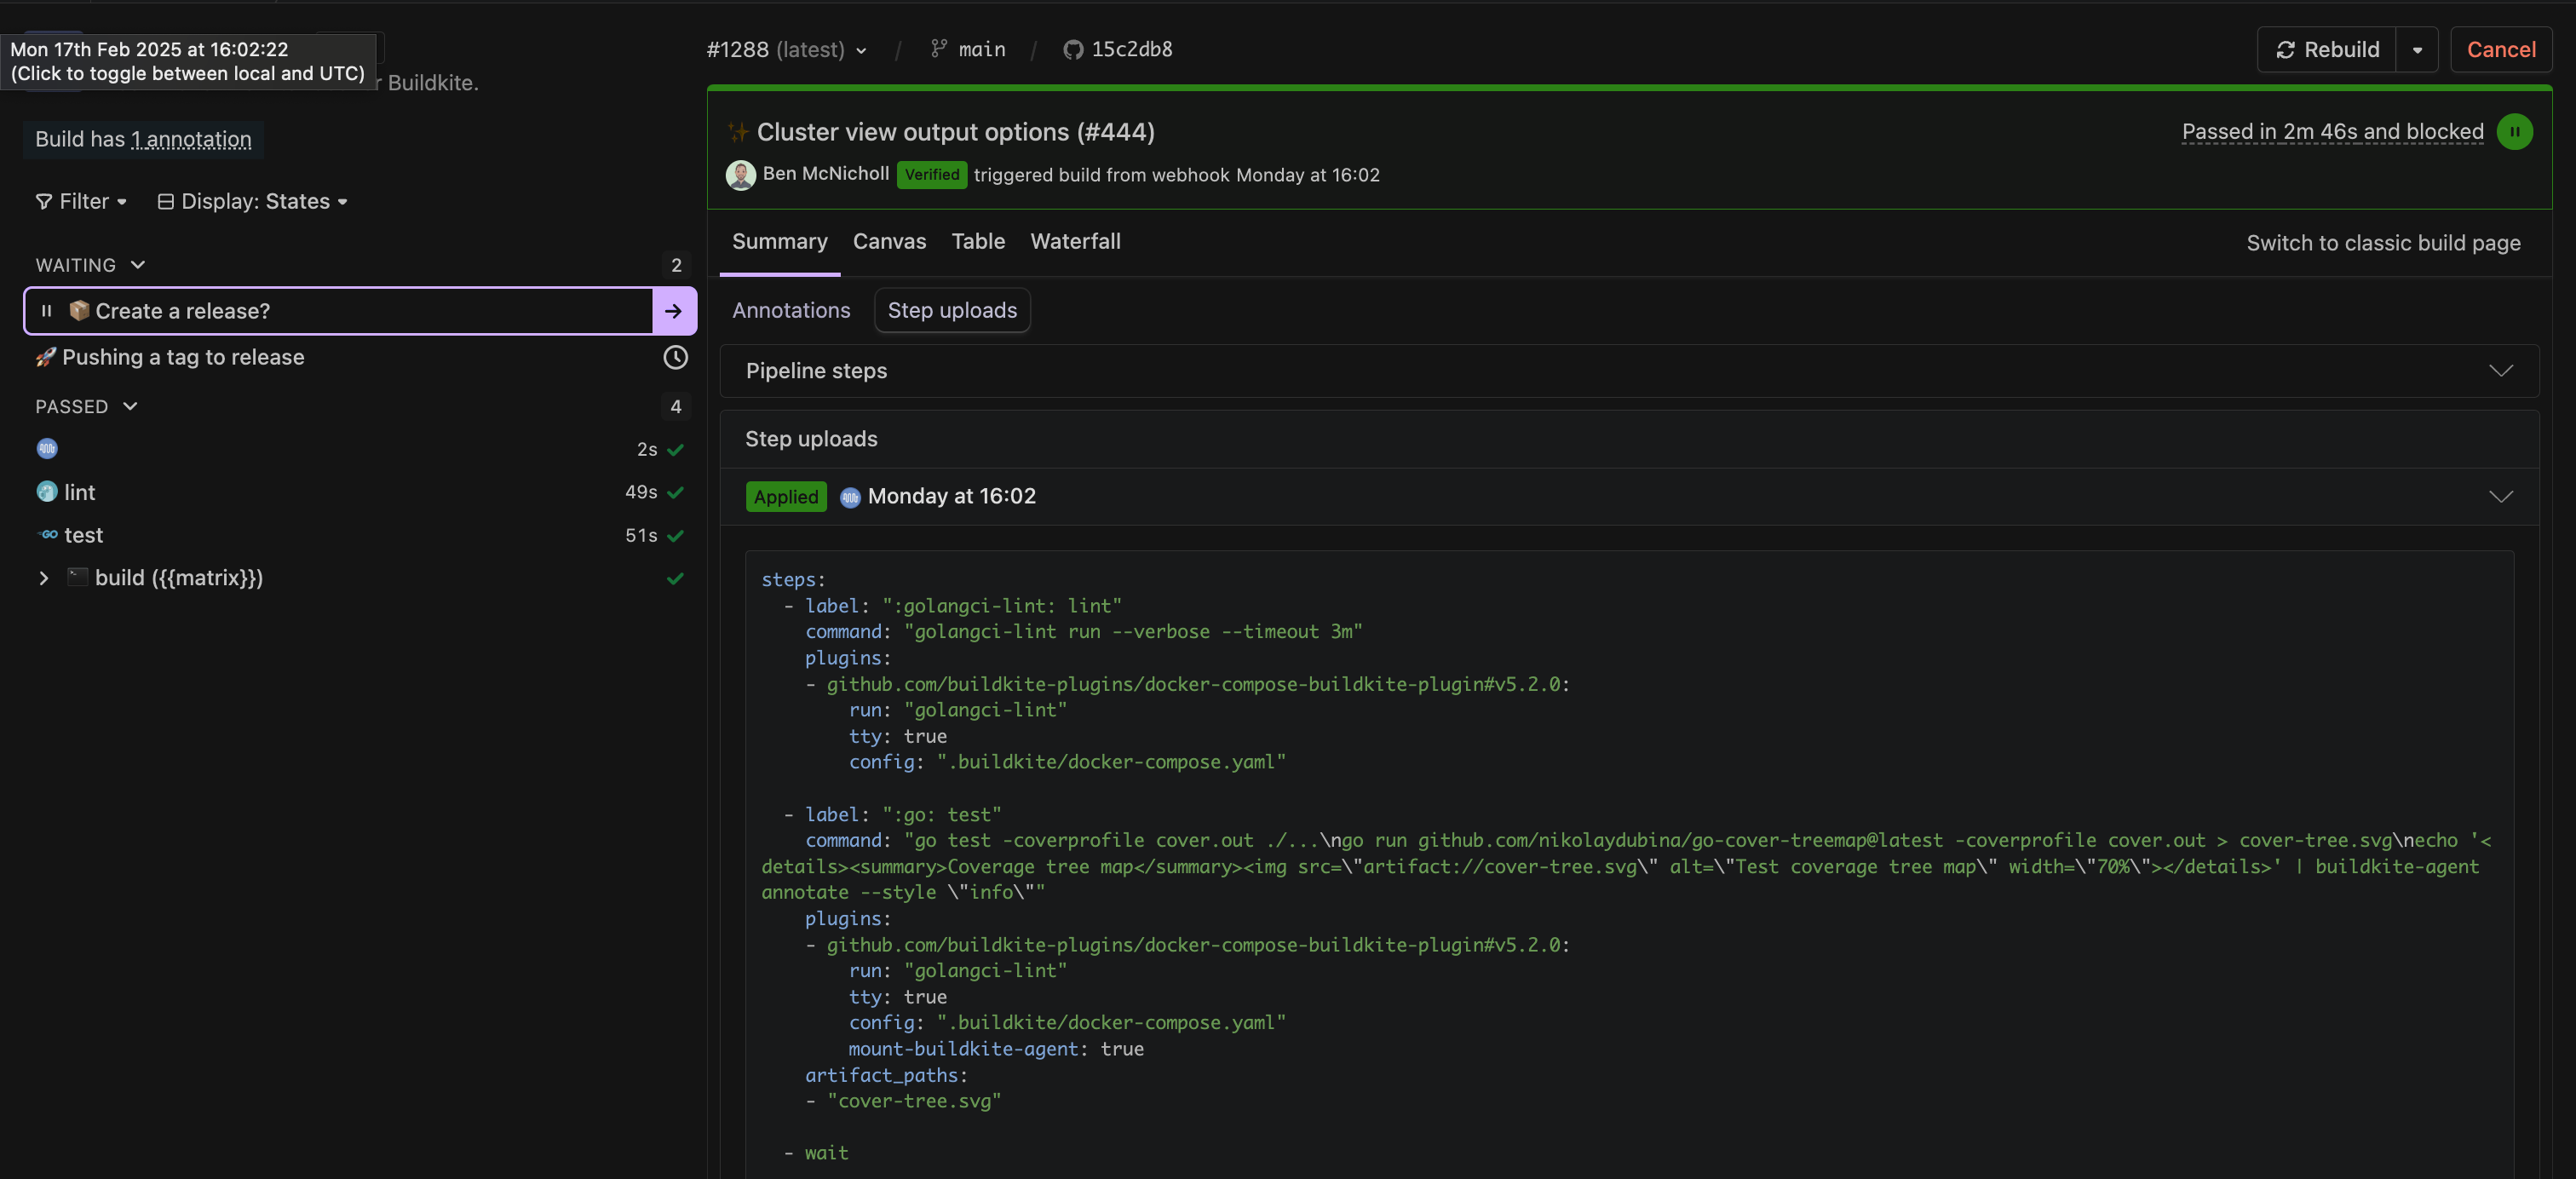
Easier troubleshooting of your build's steps
This used to be a secret page, which is why we're so excited to give this to everyone. Whilst on the new build page, you can view a pipeline's original steps and any uploaded steps as YAML directly on the Summary tab, under Step uploads. Prior to this change, troubleshooting the steps of a complicated build could proove challenging. This helps teams better understand how a build was defined and executed within each step of the build.
Allowing users to view org rules via Terraform
This change relates to a customer preview feature, Rules, for creating exceptions to Cluster security boundaries. Previously, a Buildkite organization administrator would need an API access token with the GraphQL scope to view the organizational rules using Terraform. This would prevent Buildkite organization members (non-admin users) from viewing rules through the GraphQL API, causing a conflict within the Terraform state file.
Since this change, non-admin users can view their organisation's rules the Buildkite GraphQL API, which allows users running Terraform Plan and Terraform Apply to apply Buildkite organization rules using the Buildkite Terraform provider without any state conflicts.
Tighter security posture by limiting the lifetime of OIDC tokens
Previously, we did not enforce lifetime limits on OIDC tokens. This was raised by many customers as a good opportunity to provide more constraints. Since this change, OIDC tokens now have a maximum lifetime of two hours. Read more on how to use OIDC tokens.
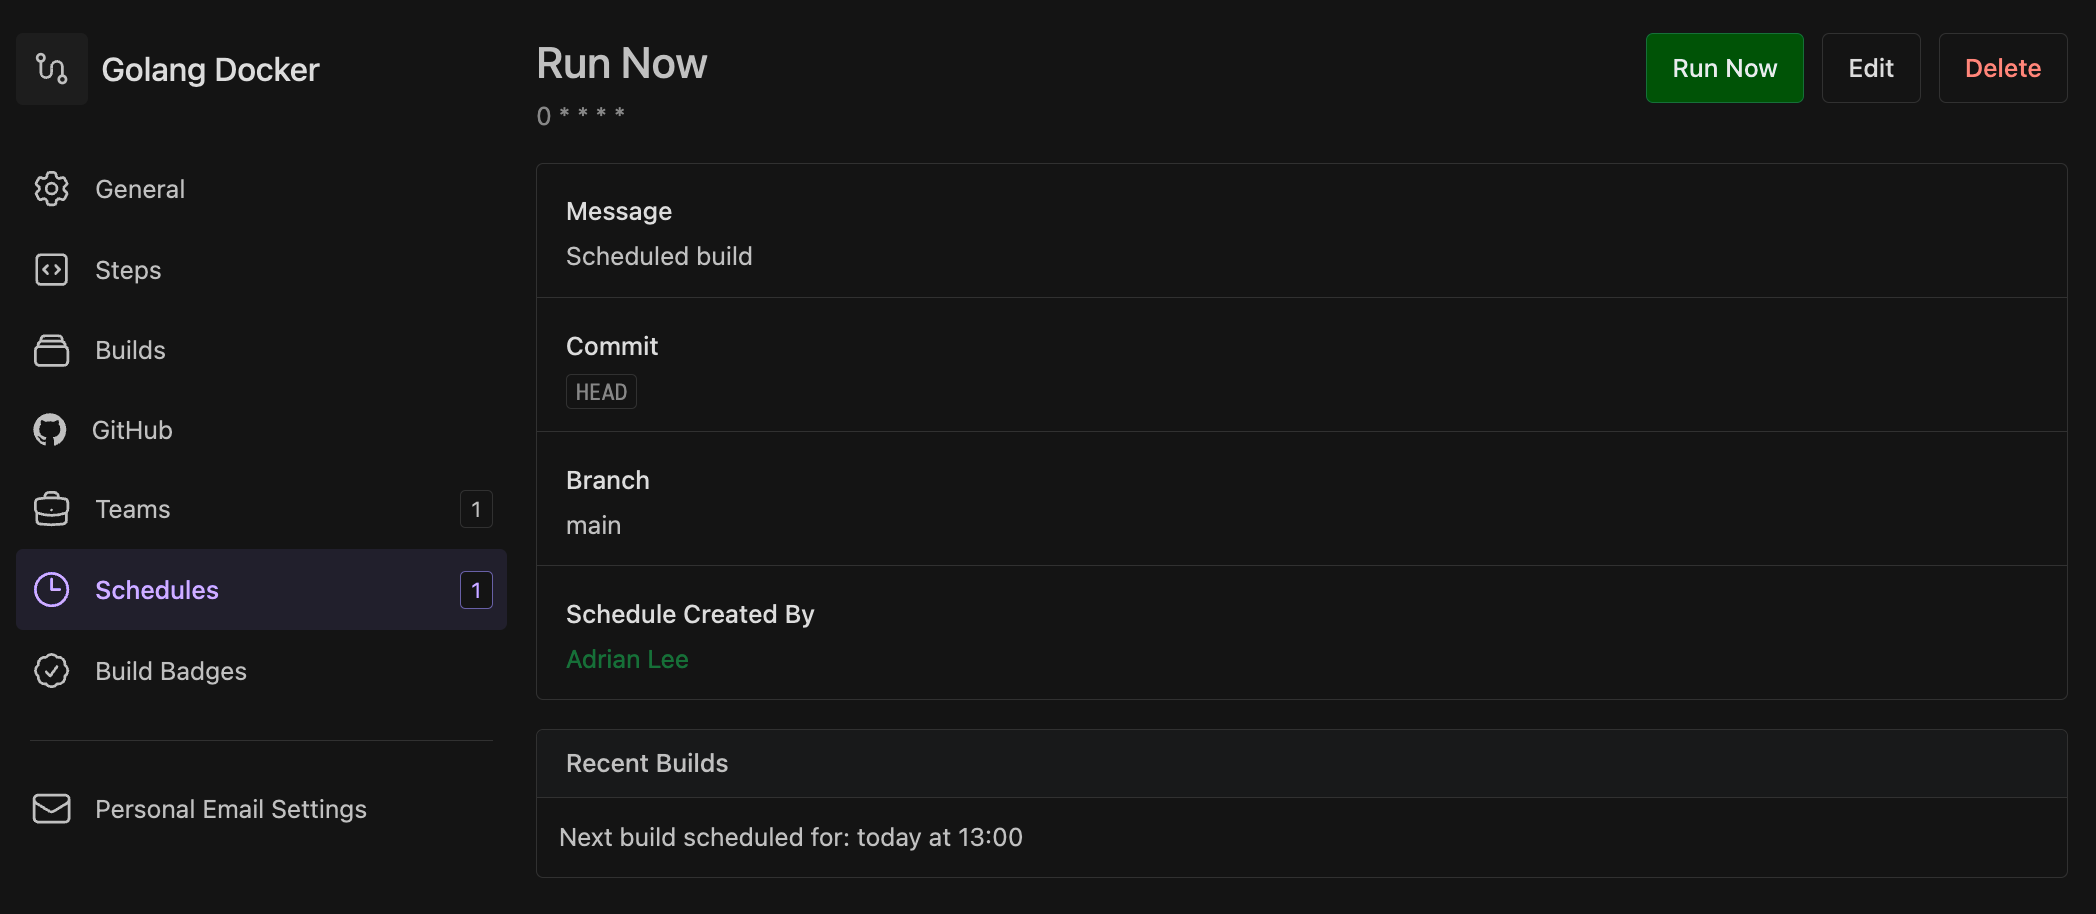
Test run scheduled pipelines
We know testing and validating scheduled pipelines can be tricky based on customer feedback. With this new button, you can now test your configured scheduled pipelines using the set environment variables. Do this by selecting the “Run now” button saving saving your scheduled pipeline.
Adrian
Introducing Cluster Insights: Real time visibility into your CI performance
We're thrilled to introduce Cluster Insights - your new command center for CI performance monitoring. Available now for Enterprise customers.
Cluster Insights delivers real time visibility into your CI infrastructure with powerful metrics that matter. At a glance, see if your teams are facing bottlenecks, track system performance, and make data-driven decisions about your CI resources.
For platform engineering teams balancing cost optimization with developer productivity, Cluster Insights provides the metrics you need. Monitor key performance indicators, identify trends, and ensure your CI infrastructure scales with your team's needs - all from a single, intuitive dashboard.
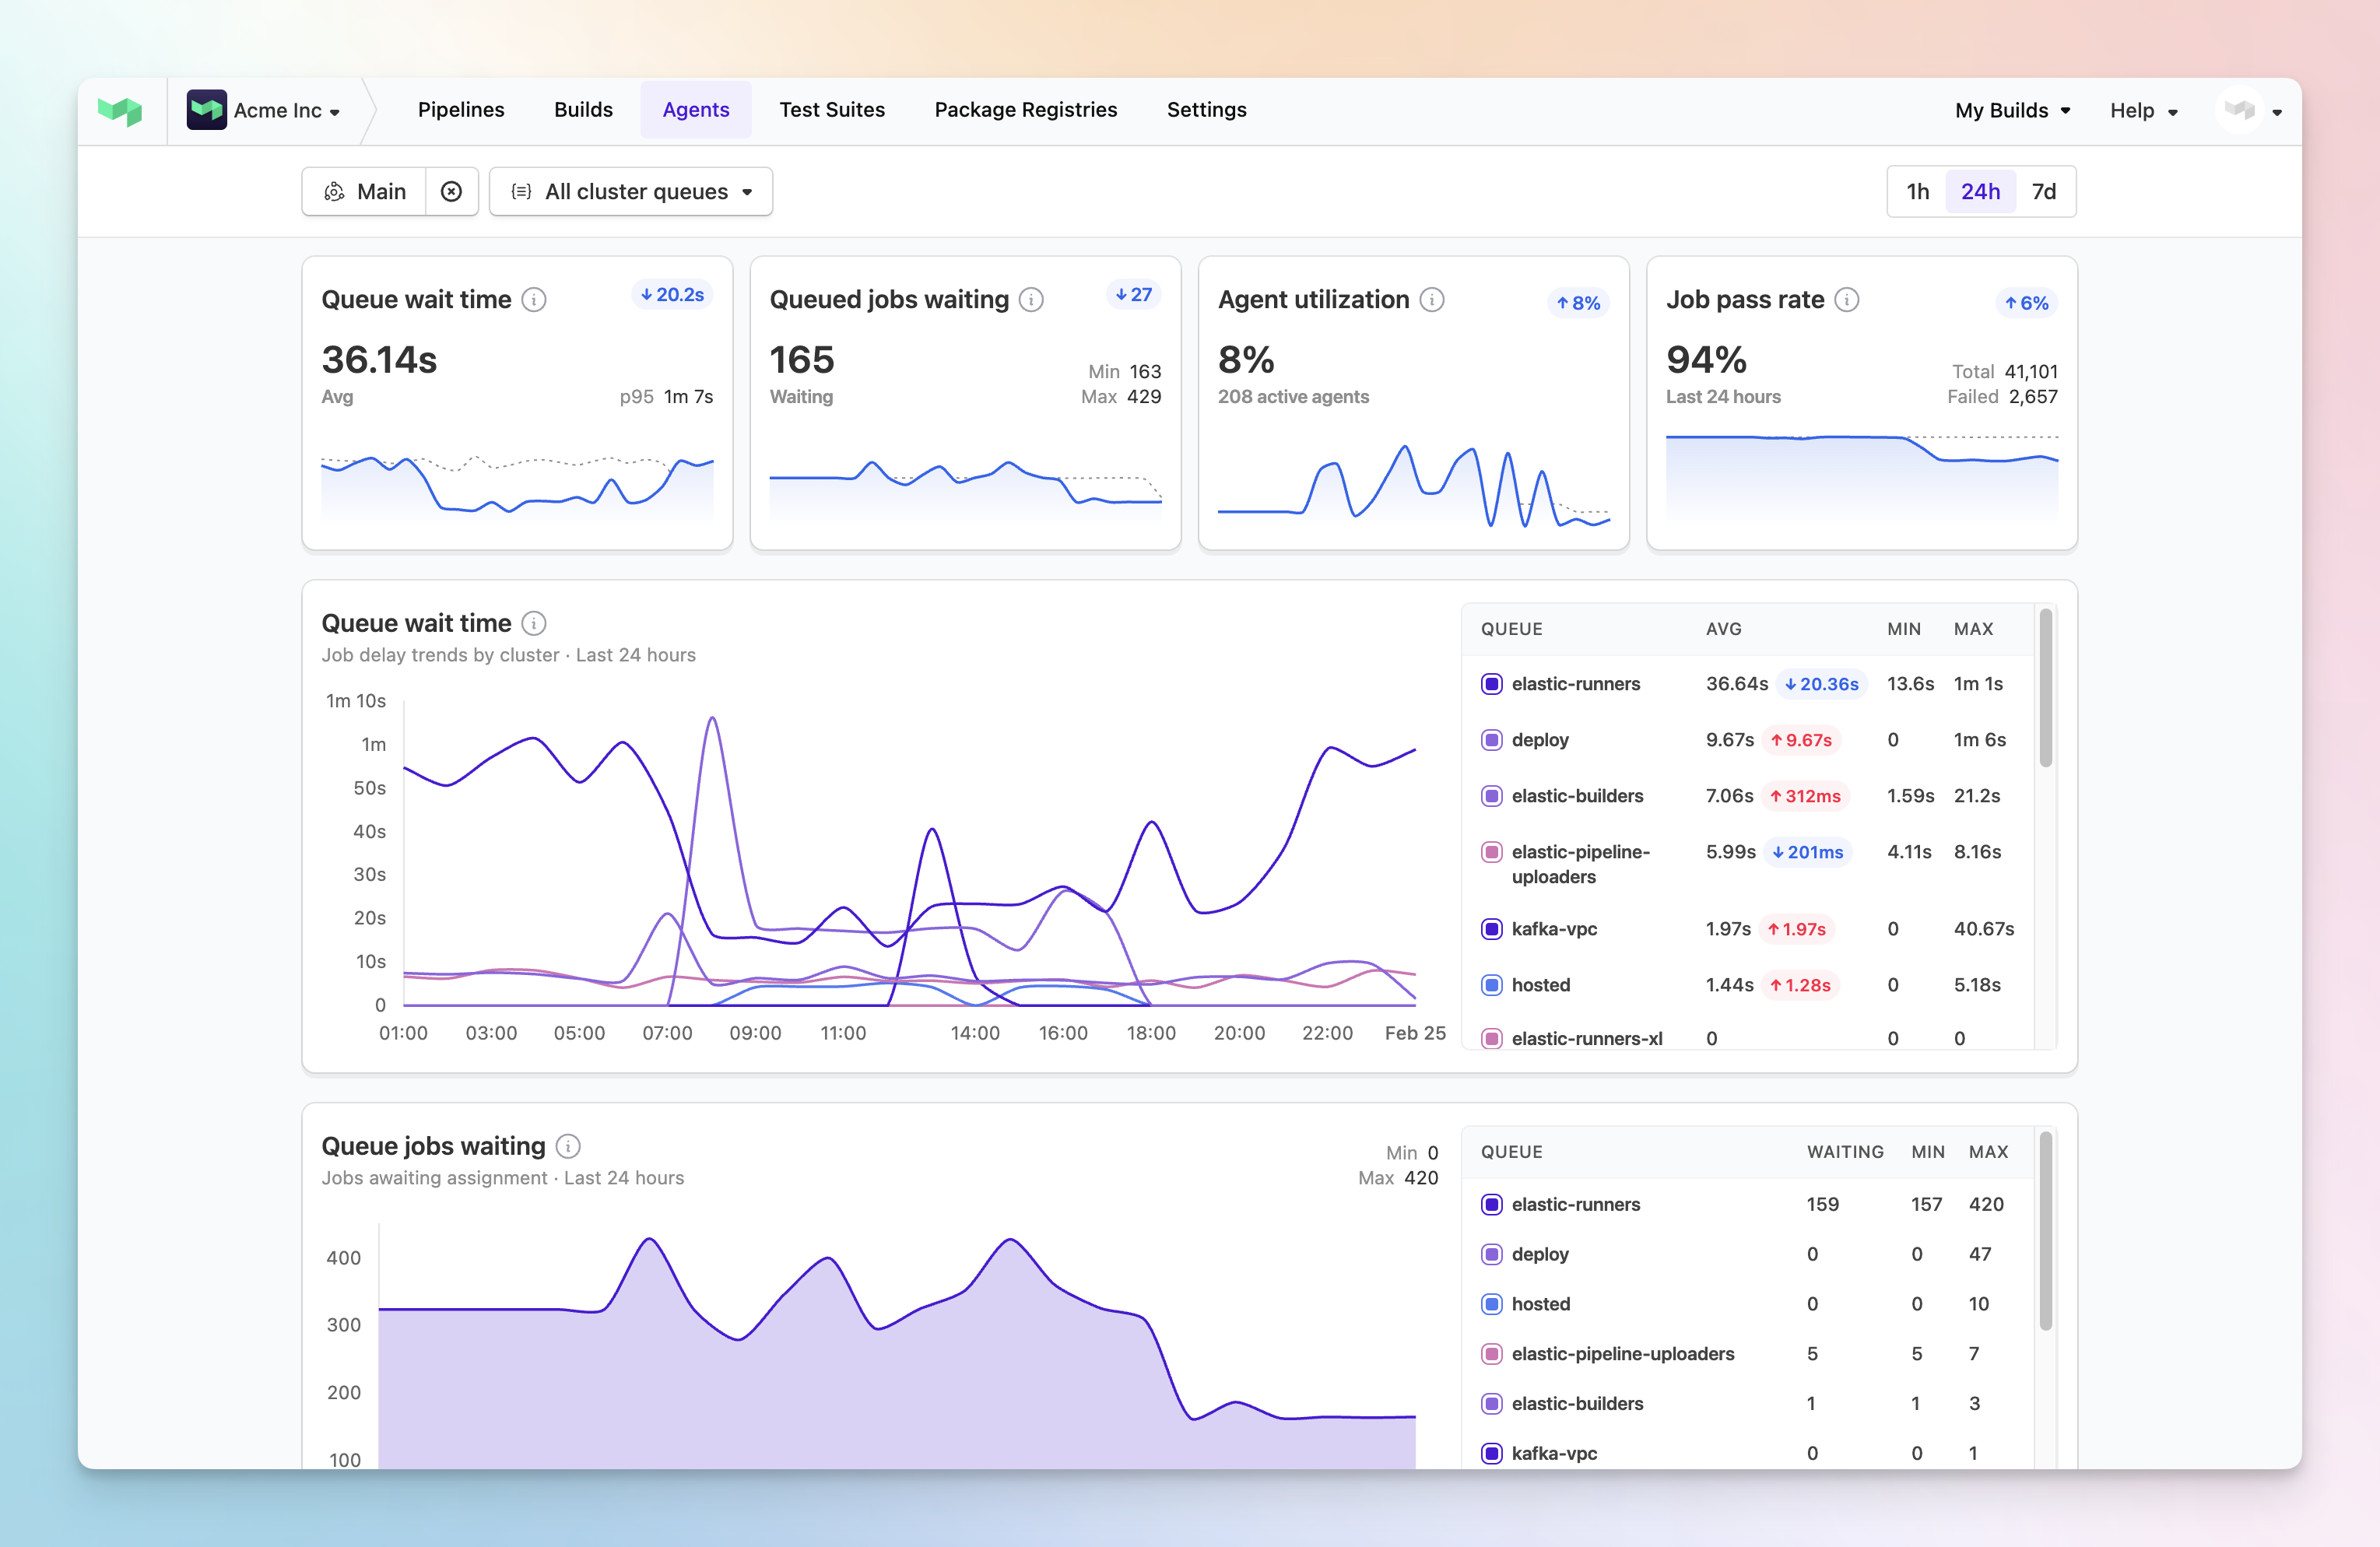
Key metrics include:
- Queue Wait Time: Track job start delays in real time
- Queued Jobs Waiting: Monitor queue depth and volume trends
- Agent Utilization: Optimize your CI resource allocation
- Job Pass Rate: Identify stability issues before they impact teams
Drill down from organization-wide views to individual queue performance, with detailed p50, p75, p90, and p95 wait time breakdowns to help you spot and resolve bottlenecks. Read our guide to Cluster Insights in the docs for more guidance on how to use these insights to improve developer productivity.
We're excited for the future and anticipate adding expanded insights across both build performance and agent-level metrics, creating an even more comprehensive CI observability solution.
Note: Metrics are only available for agents in clusters. Running unclustered agents? Contact us at support@buildkite.com to discuss cluster migration strategies.
We'd love to hear your feedback, so please let us know what you think at support@buildkite.com.
Chris
Introducing the new build page engineered for scale and flexibility
The build page has been completely reimagined to support modern software delivery at any scale. From light weight test suites to complex infrastructure deployments, this new experience adapts to your workflow while maintaining Buildkite's signature flexibility. The redesigned interface brings powerful navigation through a new sidebar and powerful table view, making it easier than ever to understand and troubleshoot your builds.
Opt in now on the build page! The new build page will become the standard experience on April 24, 2025.
TLDR:
- The new build page is here - opt in and check it out!
- Find everything faster with the new sidebar and a Table view that shows all your jobs
- A new job details drawer available on every page. You can affix to the bottom, right or docked in the center.
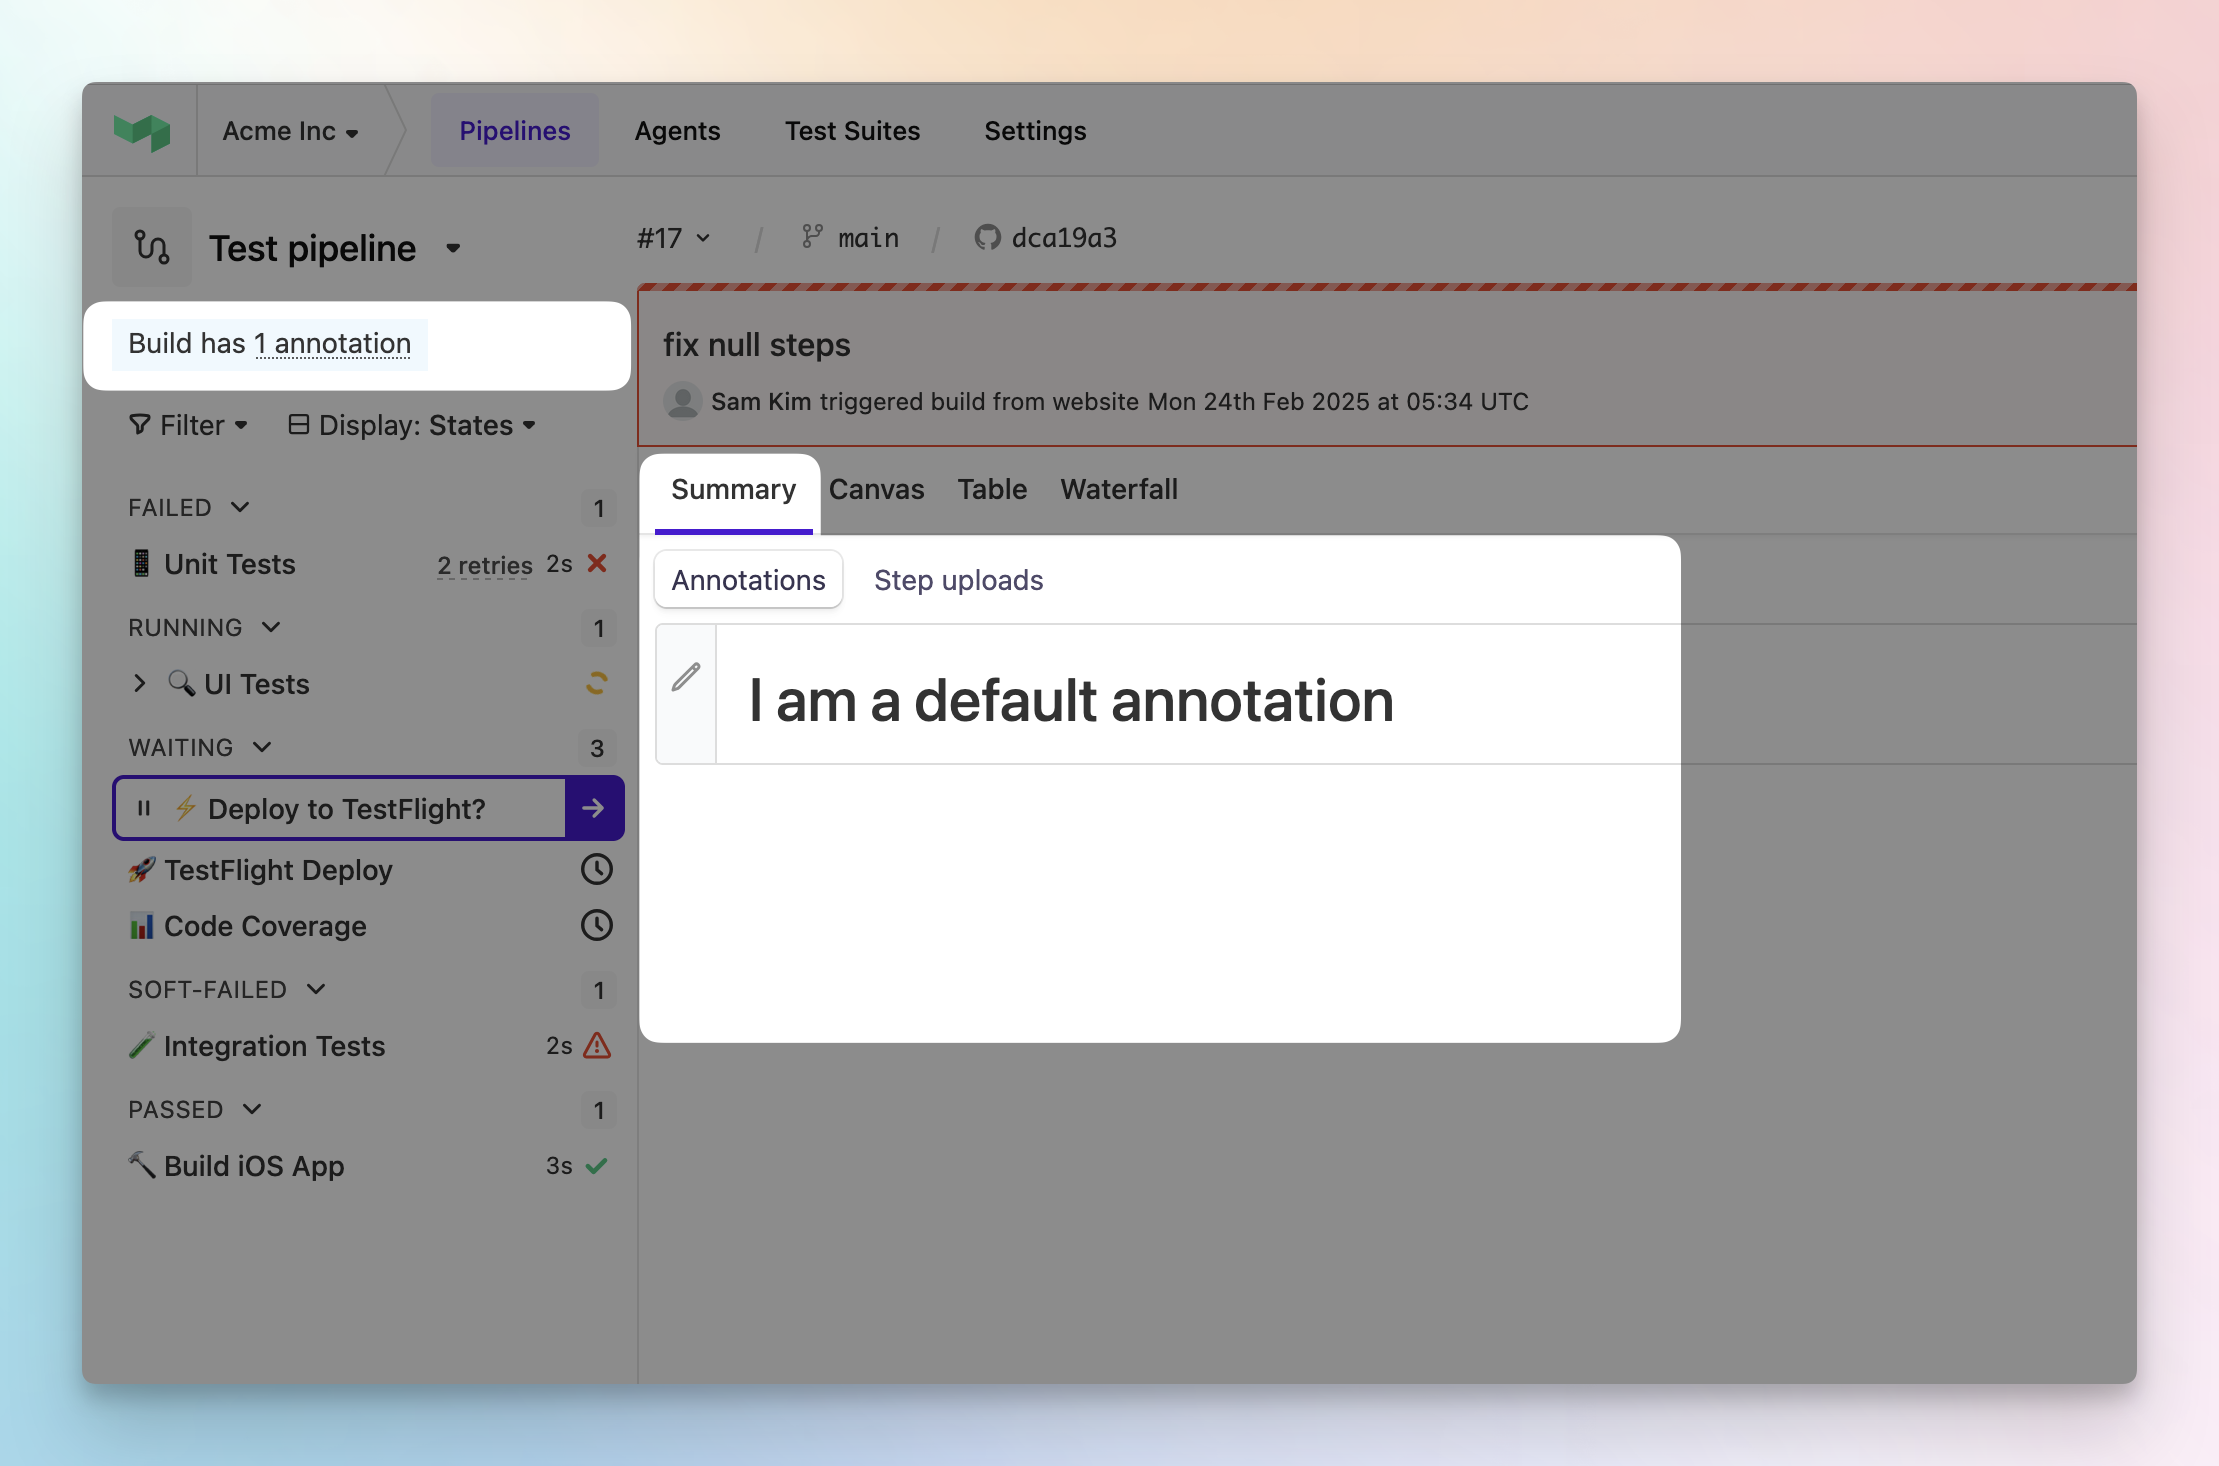
- Your annotations now live in the Summary tab, just one click away in the sidebar
- The existing views still work just like before
Enhanced Navigation and Visibility
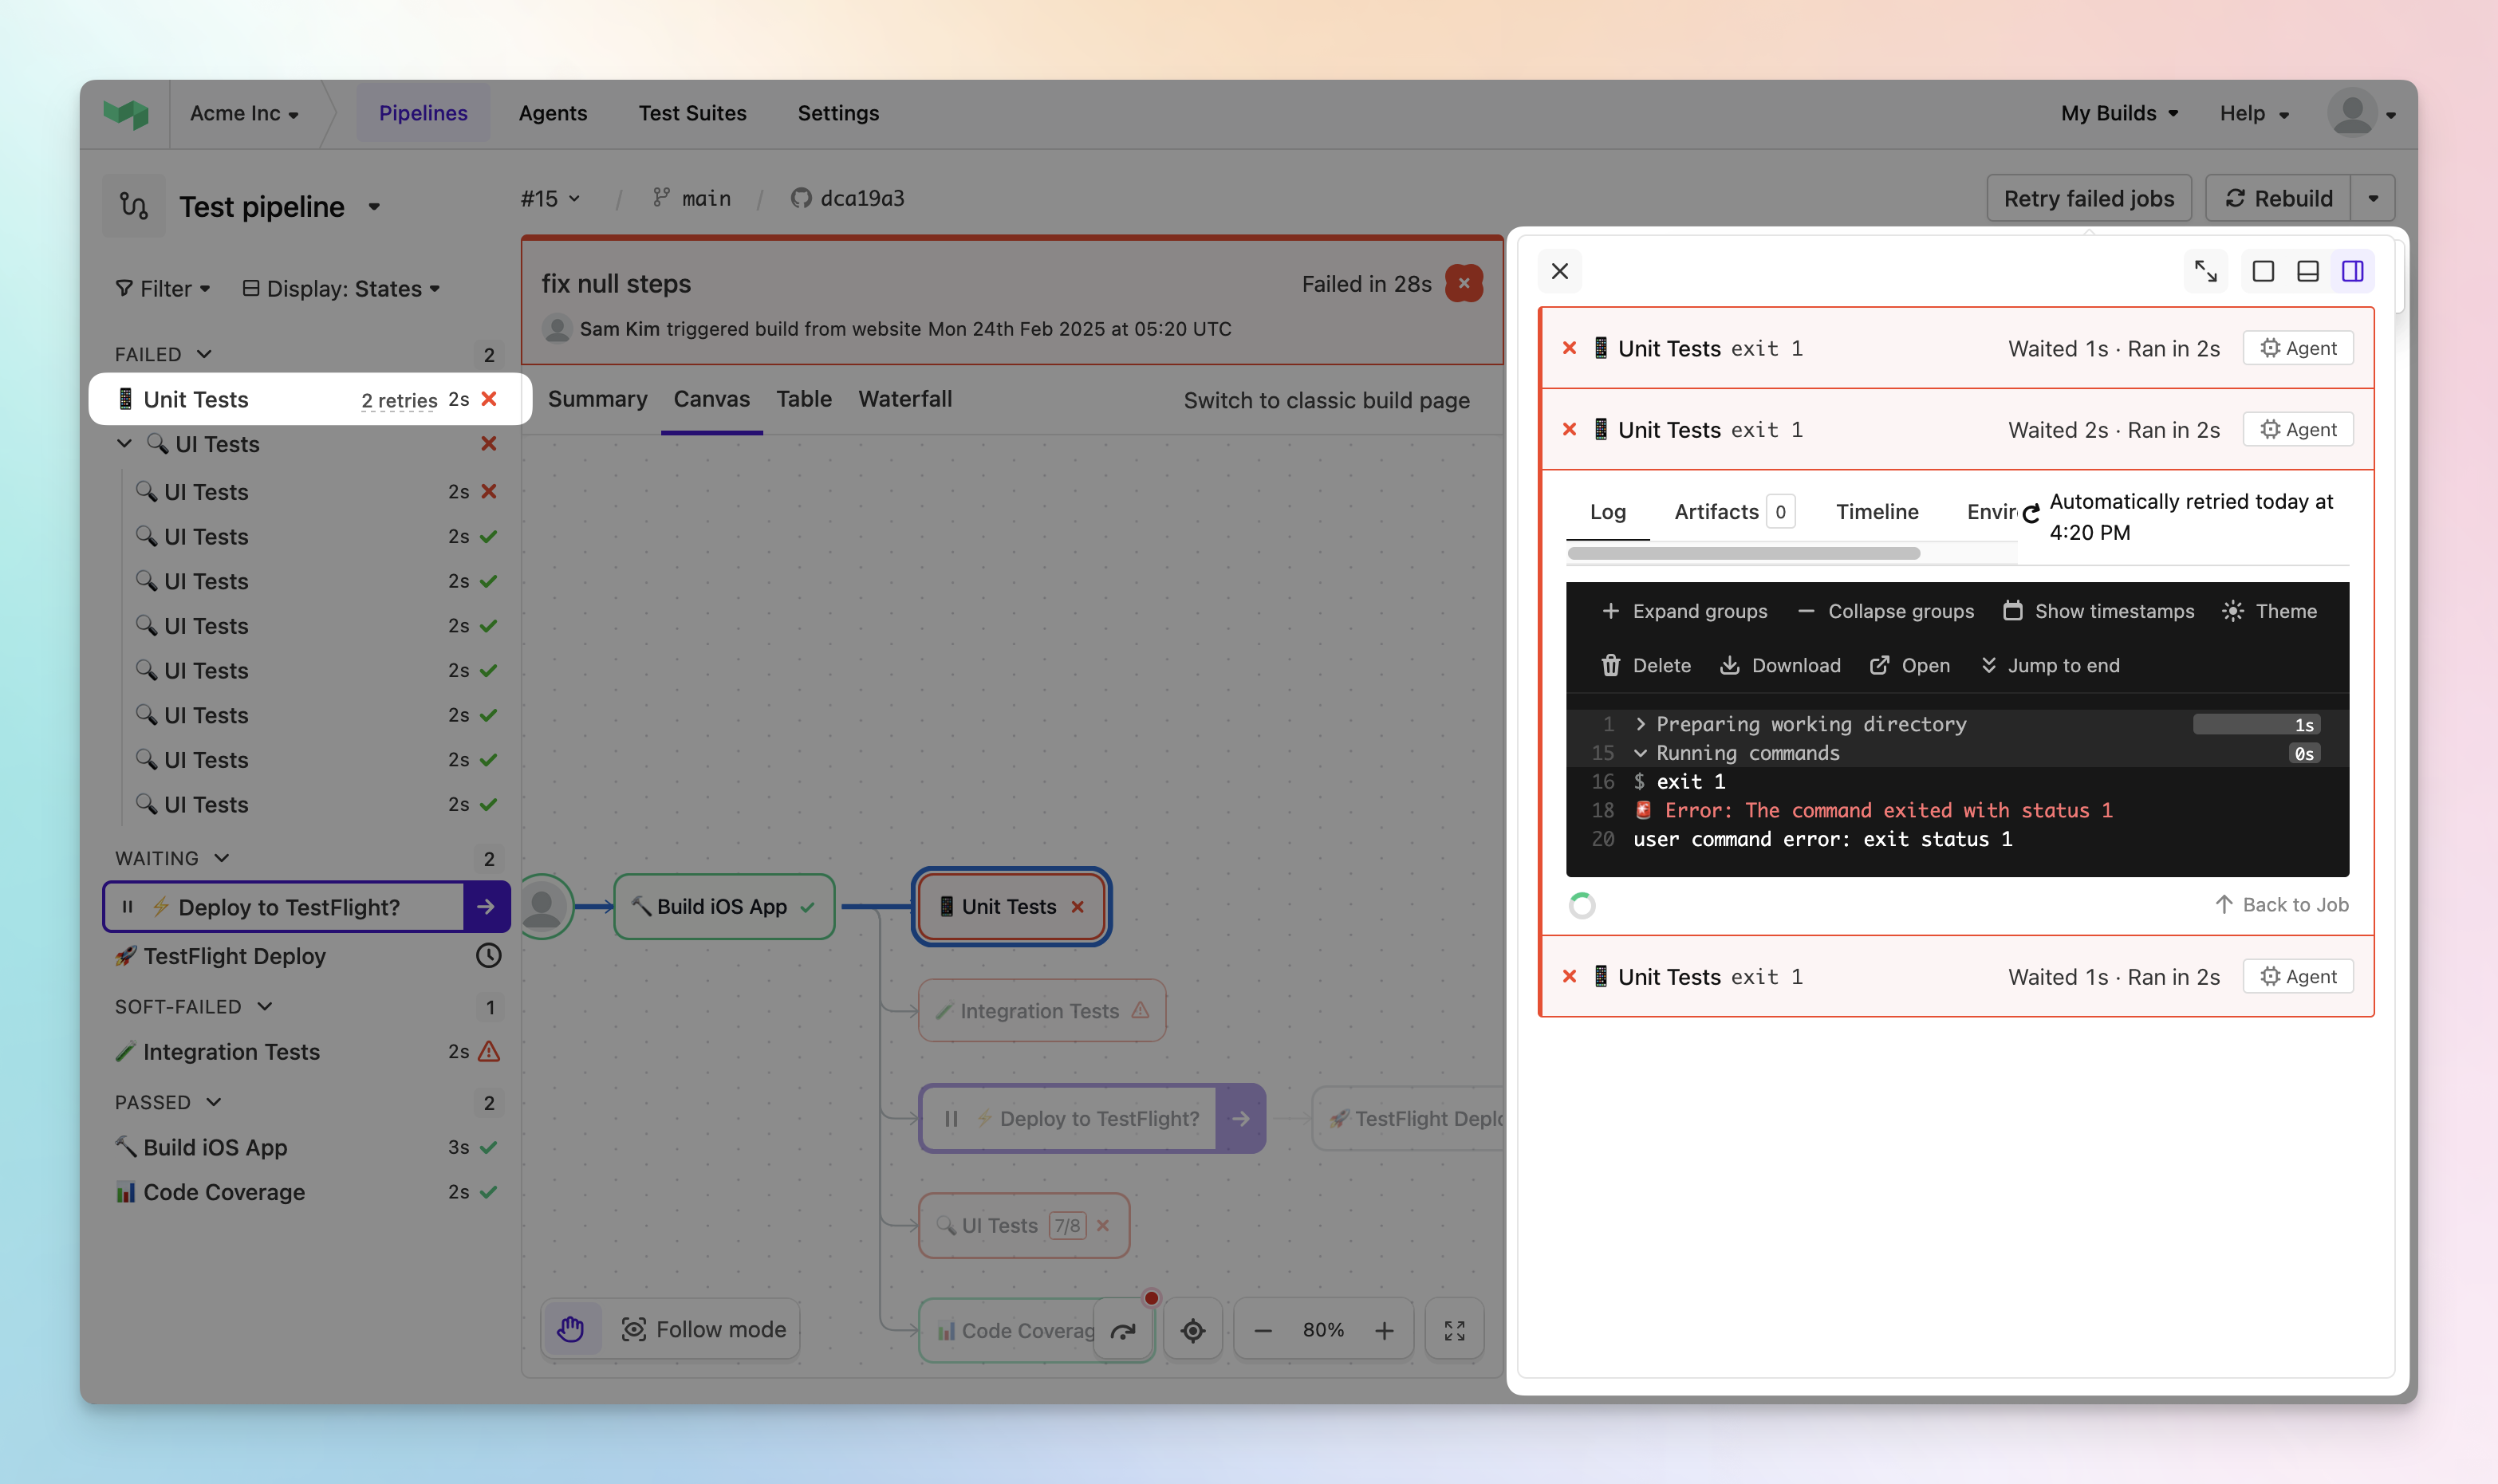
The new build sidebar transforms how you navigate complex pipelines, providing a state-based view of your build steps that makes it easy to understand progress at a glance. Quick filtering and grouping by state helps you focus on what matters, while intelligent nesting of groups, parallel, and matrix steps keeps everything organized.
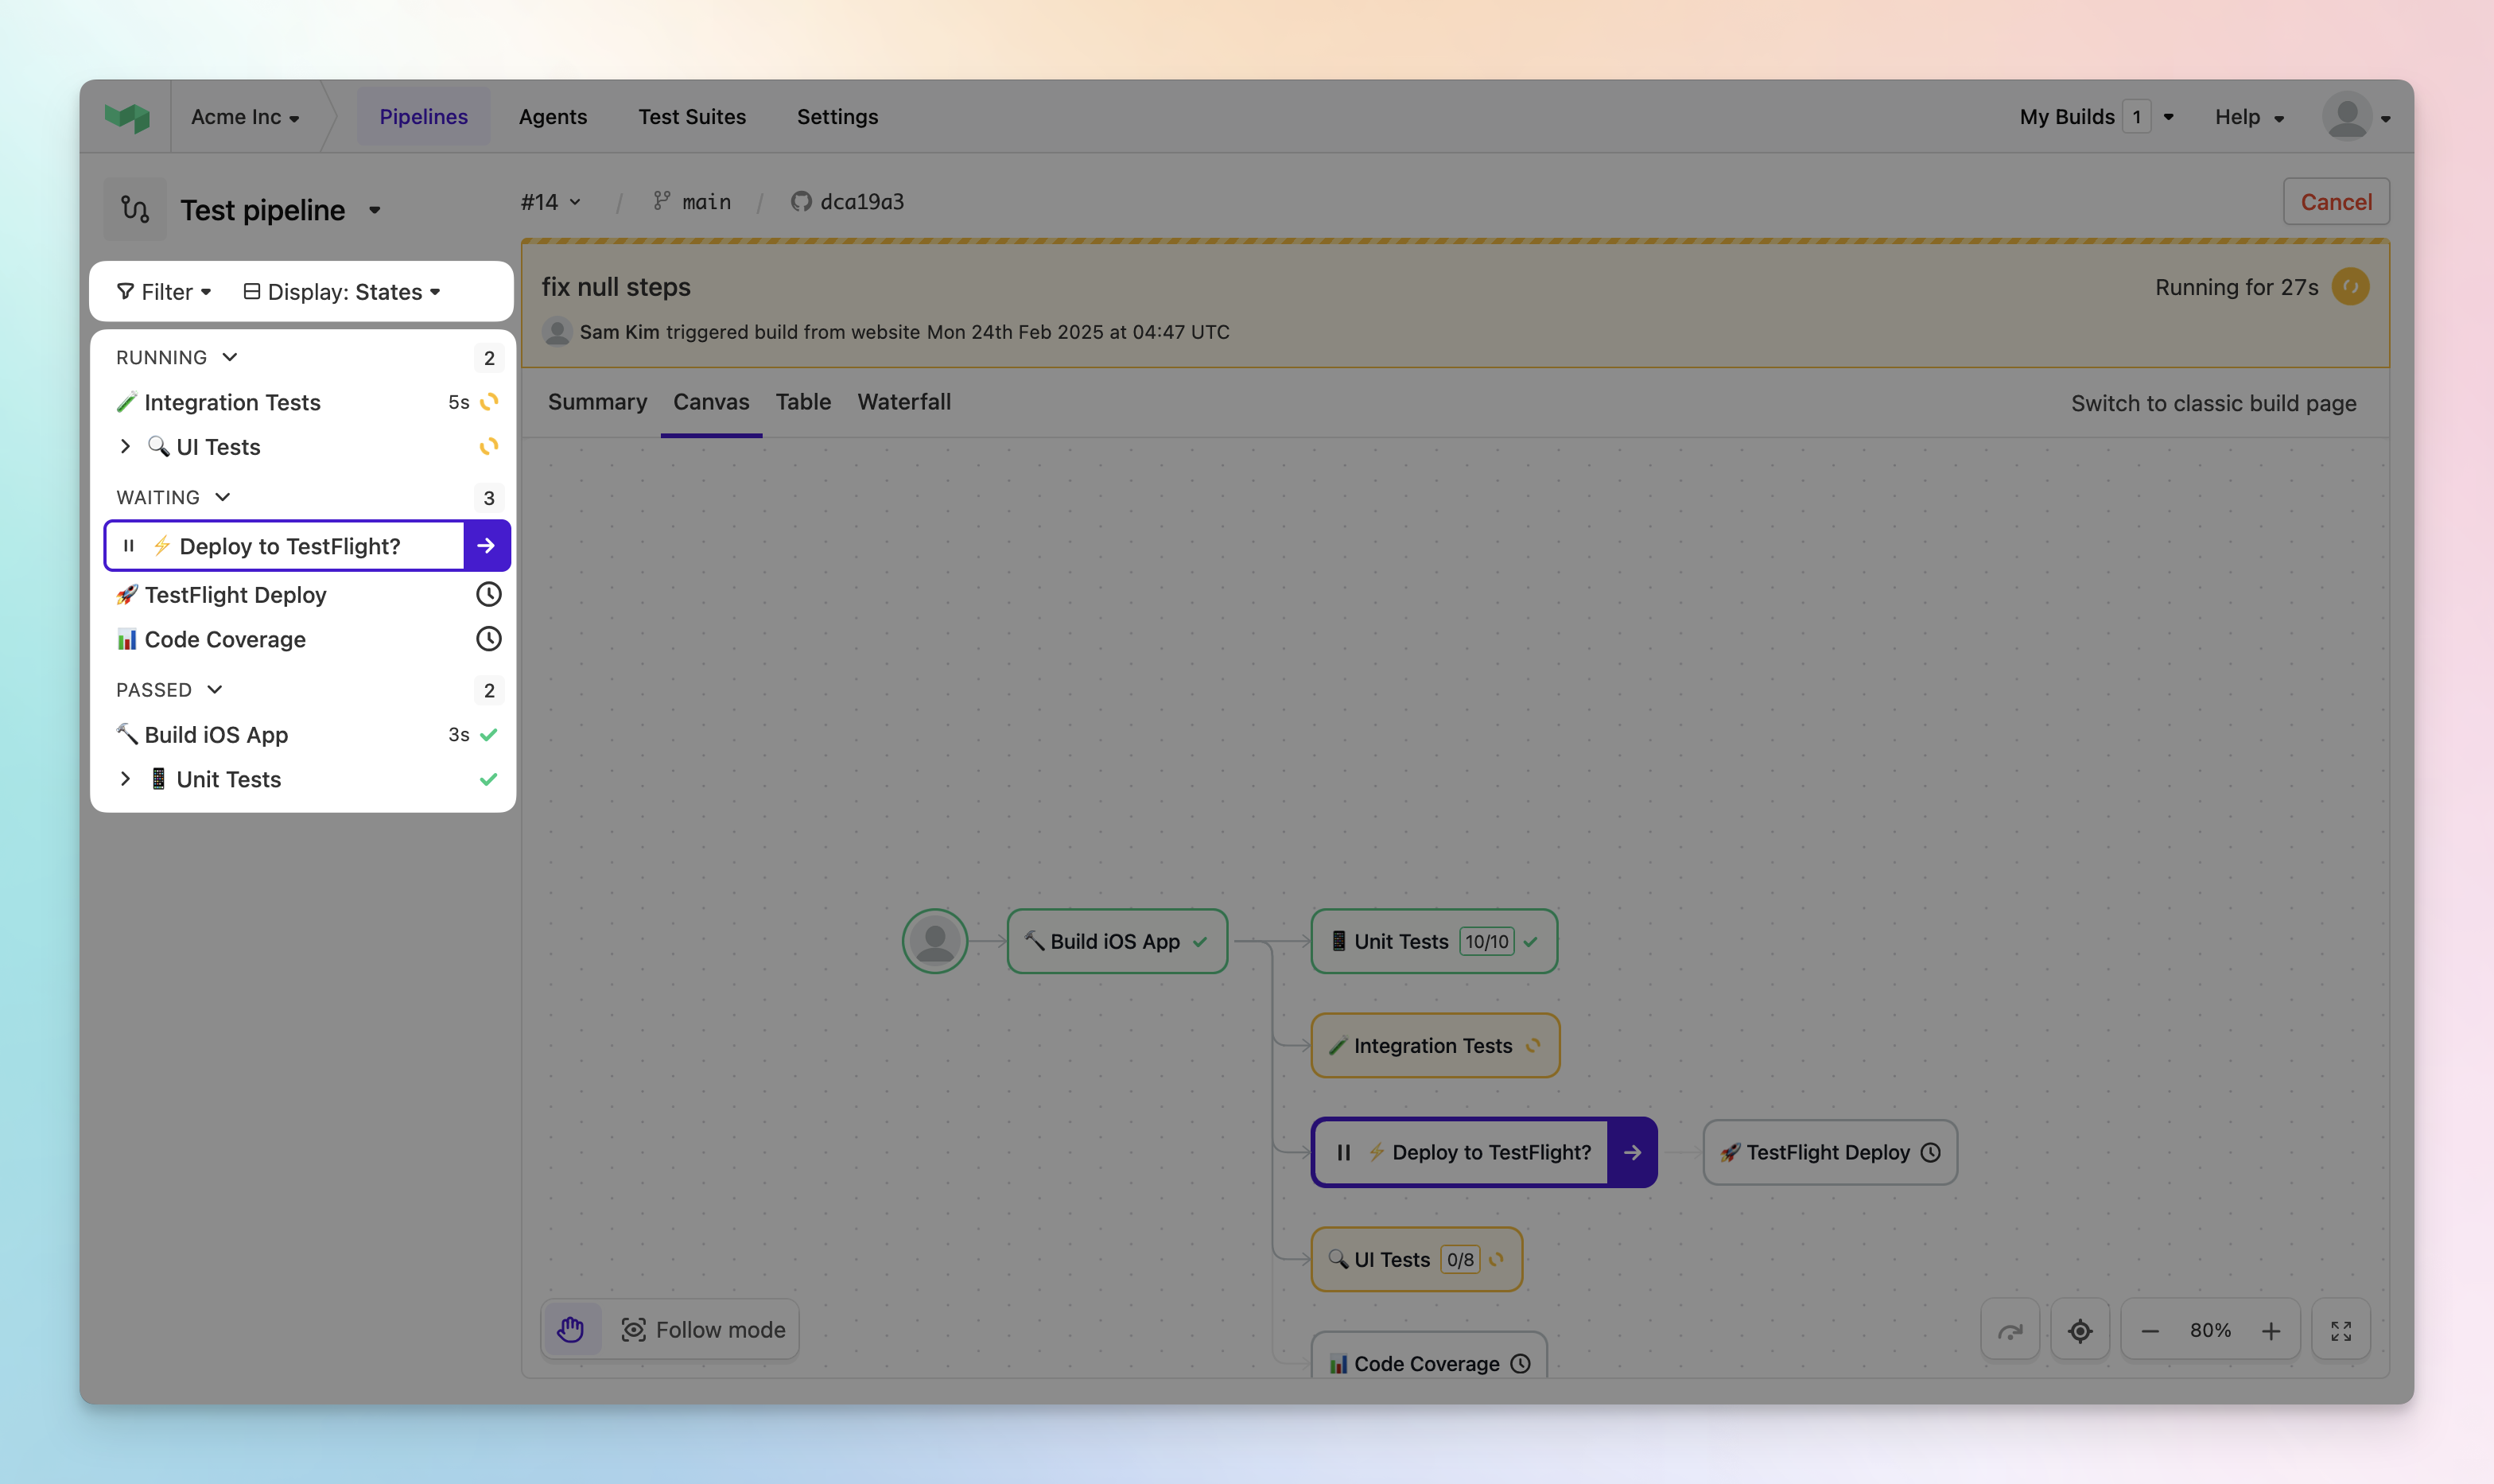
We've also introduced an adaptive layout that puts you in control, showing the highest priority items at the top. Immediately see blocked or failed steps at the top of your sidebar. Position the step log drawer on the side, bottom or center of your screen and resize it to your needs. We’ll remember your settings for convenience.
A new table view is perfect for power users looking for all queue and agent information across all jobs in one place. Clicking on column headings sorts by that column for easy browsing.
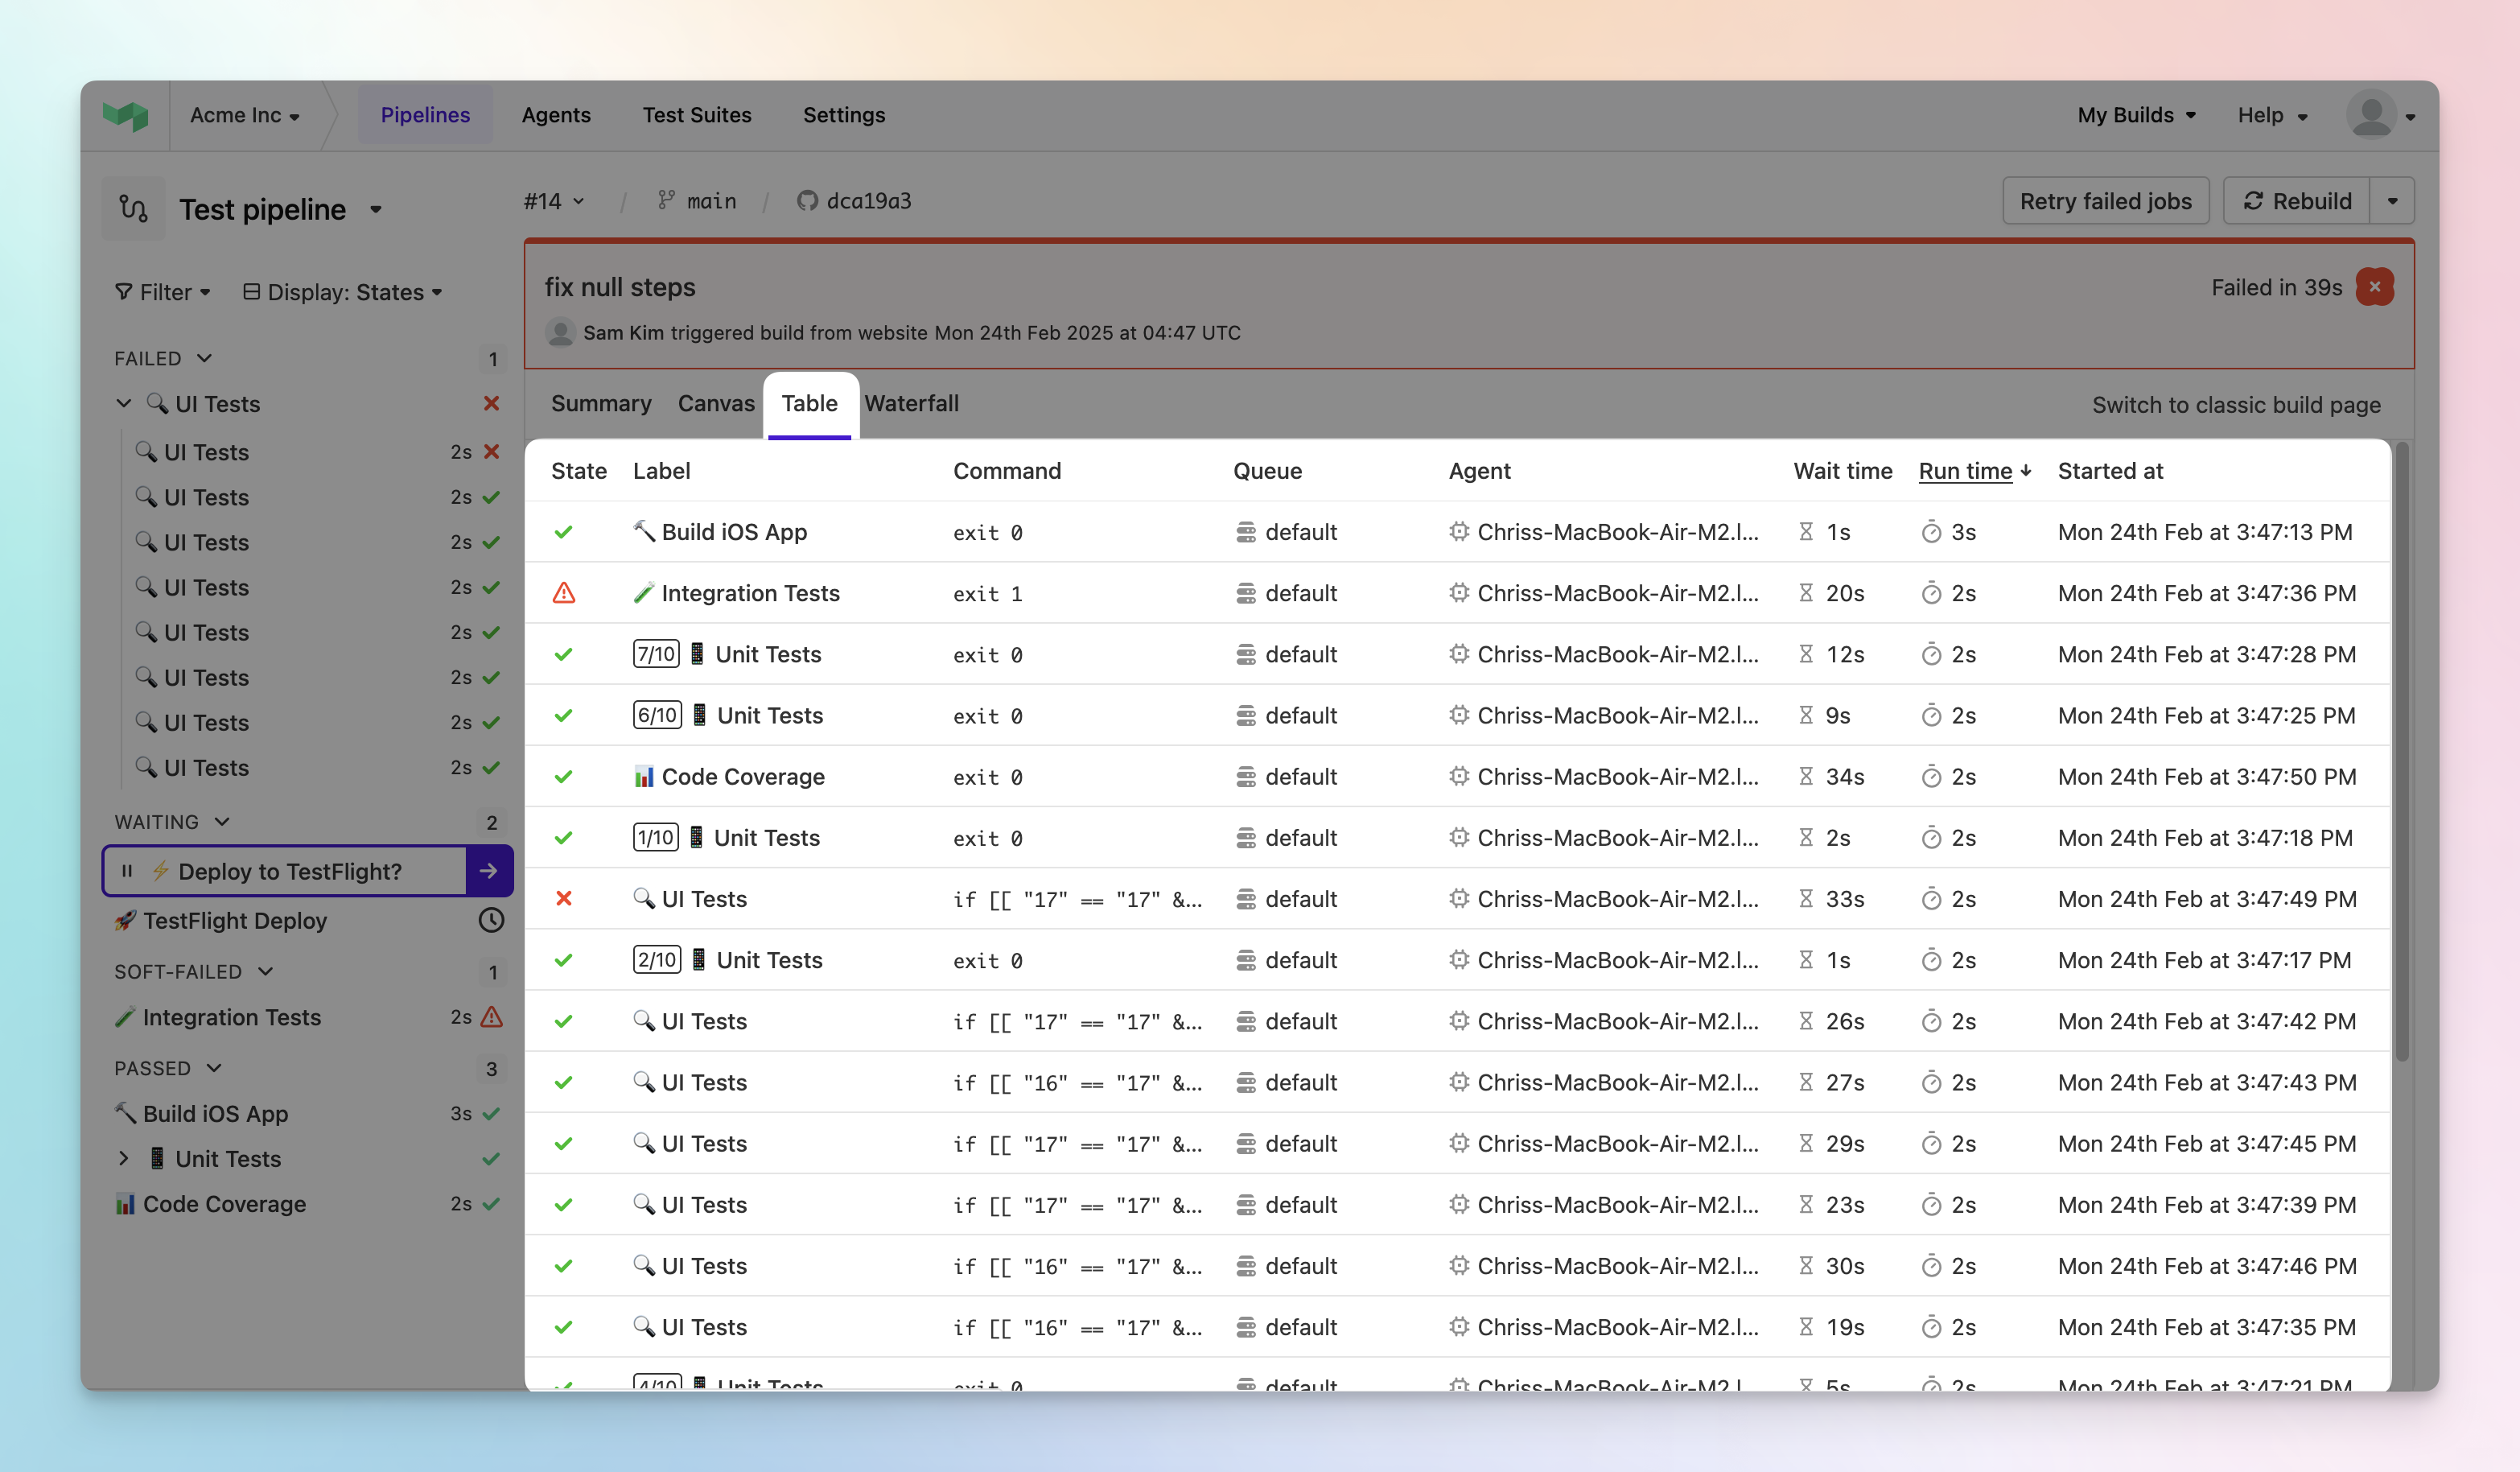
Easier Build Management
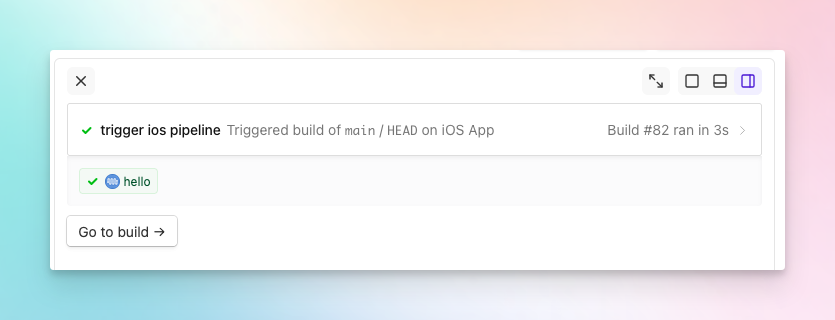
Understanding triggered pipelines is now seamless with trigger steps endowed with their own step drawer details. Monitor downstream builds directly from the parent pipeline without leaving the page - perfect for microservices architectures and fan-out CI/CD workflows where one pipeline kicks off many others.
Retries are now easier to track and manage with enhanced visibility throughout the interface. Retried steps are clearly indicated in the sidebar, with hover tooltips for quick navigation between attempts. The step drawer provides a consolidated view of all retries, letting you jump between specific executions effortlessly.
Our customers are often pushing the boundaries and scale of software delivery, so we’ve put in deliberate effort to improve the build pages’ ability to handle large scale builds. This is an ongoing journey, but we’re happy to report faster page loads for large scale builds of 500 to 10,000 steps.
Annotations and more on the Summary tab
Annotations have been moved to the Summary tab, with links to them from the sidebar. This supports annotations in the style of a 'banner' with context of the overall build.
A crowd favorite, we know many customers also use annotations to give context on individual steps, such as neater build outputs or Terraform plans. Which is why we intend to provide additional annotation types in the near future, such as a step annotation with the annotation displayed alongside step logs.
You're now also able to view all the step definitions of your build in YAML. Both initial steps and uploaded steps are available on the Summary tab, under 'Step uploads'.
Getting Started
- Look for the "Try New Build Experience" button on any build page
- Toggle between new and classic views anytime during the opt-in period
- Share your feedback to help us refine the experience at support@buildkite.com
- Read our docs page on the new build page to read about key features
Note: The classic build UI will be deprecated in two months on April 24, 2025, at which point all users will be automatically upgraded to the new experience.
Built for the Future
This redesign lays the foundation for exciting capabilities coming to the build page in the future. Here are some improvements we're planning:
- Enhanced personalization options to remember your preferred default view settings
- Improved table view with better customization
- Collapsible sidebar for maximizing screen space
- Step-level annotations for more granular build insights
- Multi-log viewing to compare outputs side by side
- Collapse groups of steps on the canvas to optimize rendering
- Unblock builds with one click
- Critical path analysis in the canvas
This new build experience is just the beginning. We're committed to making Buildkite the most powerful and flexible platform for software delivery, and this update sets the stage for even more improvements to come.
Please reach out to support to let us know your feedback at support@buildkite.com once you've tried it. We're keen to ensure this new update suits the wide range of customers and use cases for which Buildkite is known.
Chris
Cancelling hanging jobs
We have rolled out a new fix for pipelines that have hanging jobs.
If you are using test splitting queues such as Shopify's open source tool ci-queue (https://github.com/Shopify/ci-queue) at scale, you may have noticed that some jobs are hanging around and causing your builds to take longer than expected.
There is now a new agent cli command to cancel these pesky jobs to improve your build times.
To force cancel all jobs in a step you can run the following from any job within the target build:
buildkite-agent step cancel --step <step_key> --forceIn this kind of situation you may have a pipeline that looks like this:
steps:
  - command: test_reporter.sh
    key: reporter
  - command: test_worker.sh
    key: workers
    parallelism: 500
    soft_fail: true
In this pipeline the workers are responsible for running the tests but the outcome of the tests is reported by the reporter step. The outcome of the workers in Buildkite is not relevant to the build outcome. When a step is marked as soft fail Buildkite still waits for all jobs to finish before marking the build as passed. This can cause the build to take longer than necessary. To fix this you can add a step to cancel the workers after the reporter step has finished.
steps:
  - command:
      - test_reporter.sh
      - buildkite-agent step cancel --step workers --force
    key: reporter
  - command: test_worker.sh
    key: workers
    parallelism: 500
    soft_fail: true
If you find this cancels too quickly, leaving agents unable to upload logs and artefacts, you can set a custom a grace period with the --force-grace-period-seconds flag. This will allow the agents to finish their work before being cancelled.
steps:
  - command:
      - test_reporter.sh
      - buildkite-agent step cancel --step workers --force --force-grace-period-seconds 10
    key: reporter
  - command: test_worker.sh
    key: workers
    parallelism: 500
    soft_fail: true
Quinn
New Slack Workspace Integration
We've created a new Slack notification service for easier management of your Slack notifications. This new notification service requires only a single authorization for the entire workspace and replaces the need for multiple Slack notification services. See the documentation for enabling a Slack Workspace for your organization. Going forward, we recommend using Slack Workspace. Connecting this new notification service will not impact current implementations.
With this change comes:
- Build notifications now include mentions when triggering builds using an account with an associated email in slack workspace.
- Build notifications can be filtered to only trigger on the first failure with
started_failing, rather than notifying on recurring failures. Using YAML, this is possible in the existing slack integration and the new workspace. - Slack channels are now configured in pipeline YAML when using slack workspace.
Eleanor
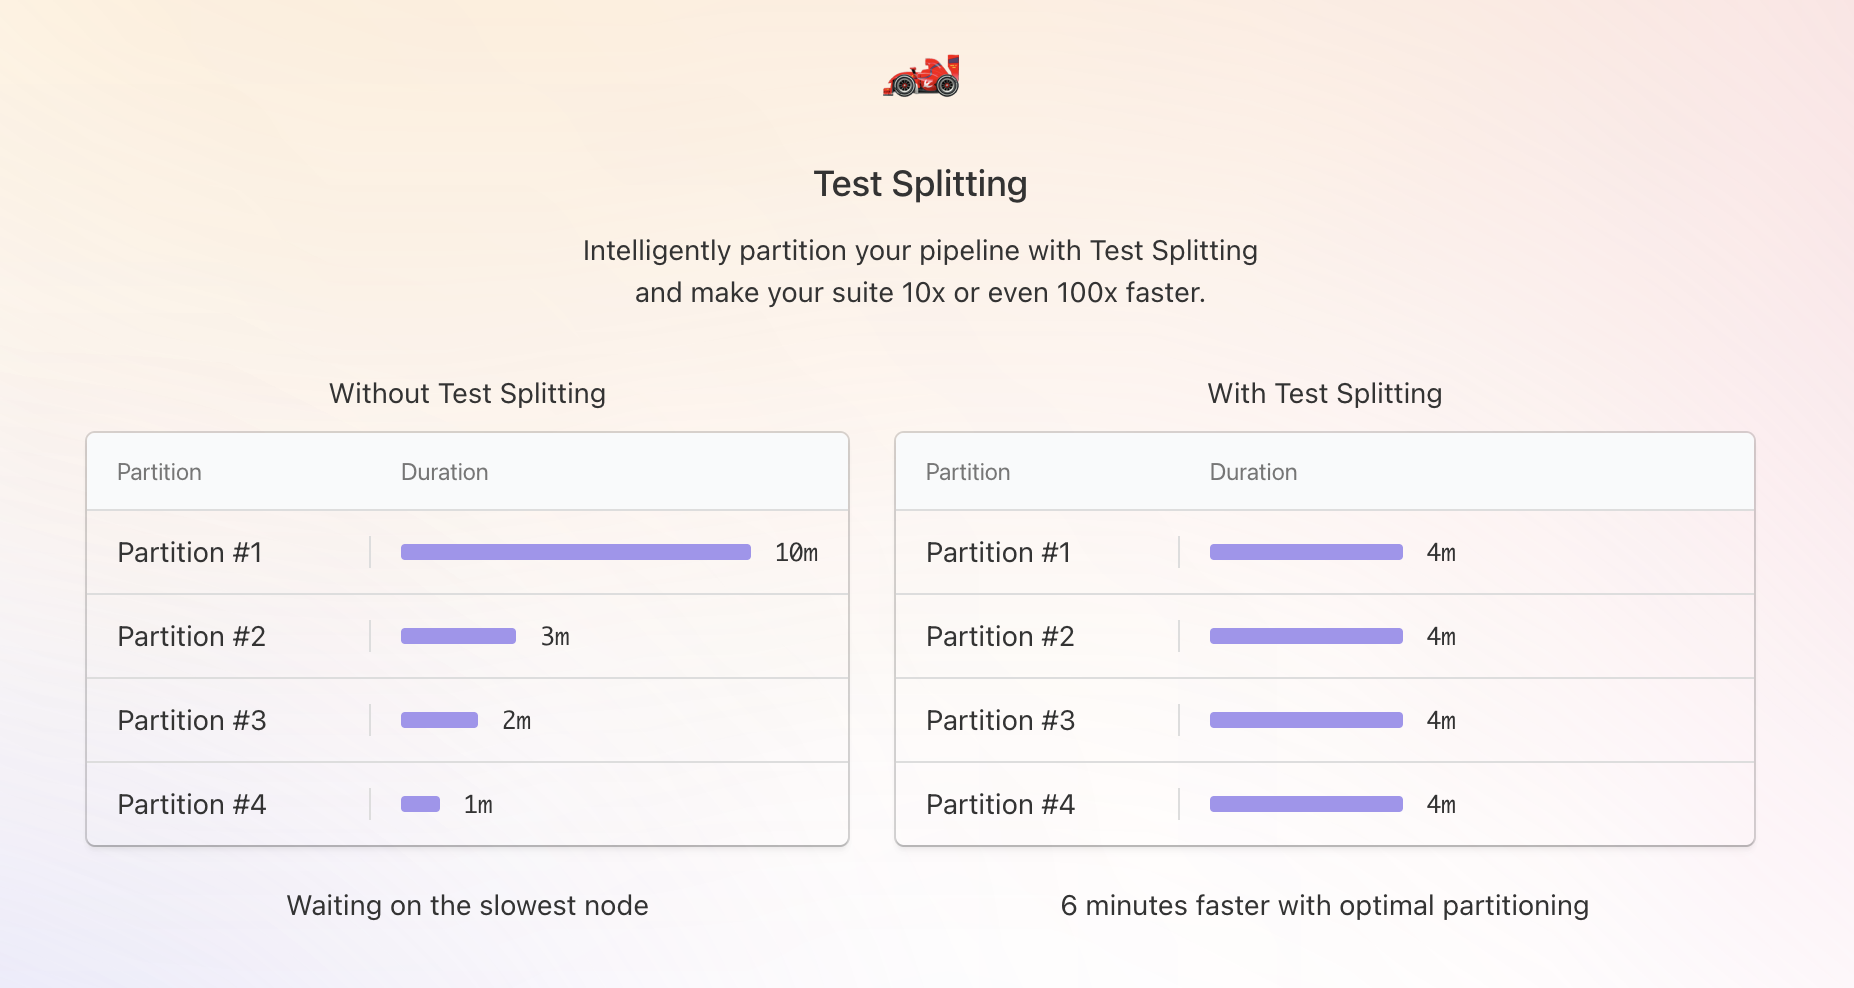
Playwright Test Splitting Support
We're excited to announce Playwright support for our Test Engine Client, to complement RSpec and Jest as supported test frameworks for test splitting. The client uses timing data obtained from your test suite to intelligently partition your tests across parallel agents, reducing the time taken to run them.
To begin using the client with Playwright, you can follow the instructions in the Playwright documentation in the Test Engine Client repository.
Stephen
Team management in suite settings
We've introduced team management to the suite settings page.
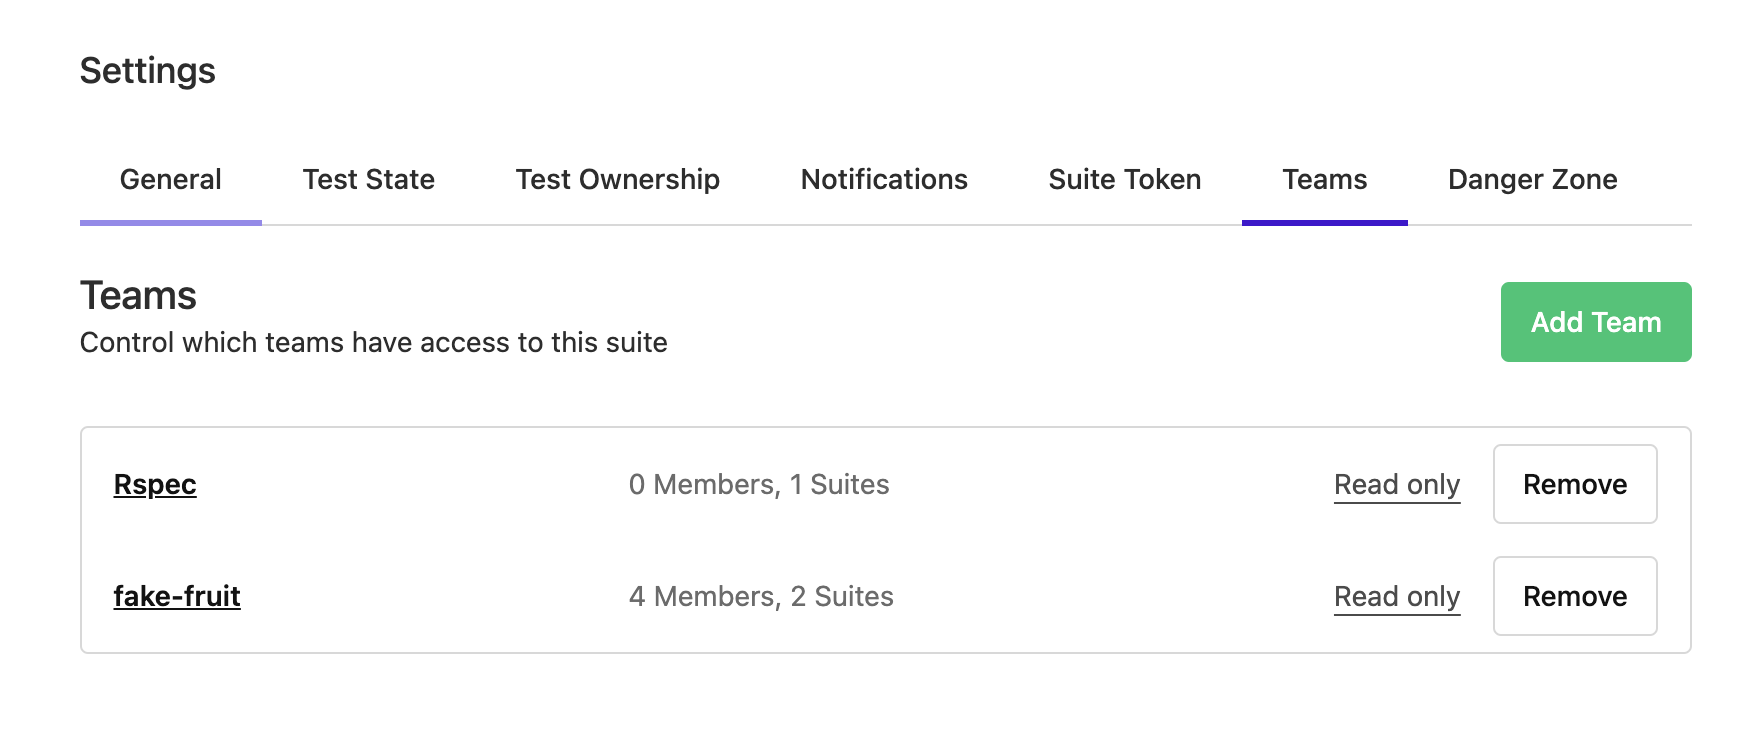
Users with permission to edit the suite can:
- Add & Remove Teams: Easily control which teams have access to the test suite.
- Edit Permissions: Adjust team permissions directly from the Teams page.
- Team Insights: View the total number of users in each team and how many test suites each team can access.
- Quick Navigation: Click on a team to navigate directly to its details page for managing team members.
This feature streamlines team access management, allowing users to configure permissions and team memberships efficiently within their test suite environment.
Katie
Date filtering on flaky test page
We've added a date filter to the flaky tests page, allowing users to refine the list of flaky tests based on set date ranges. Users can now filter flaky test results from the last hour up to the last 28 days.
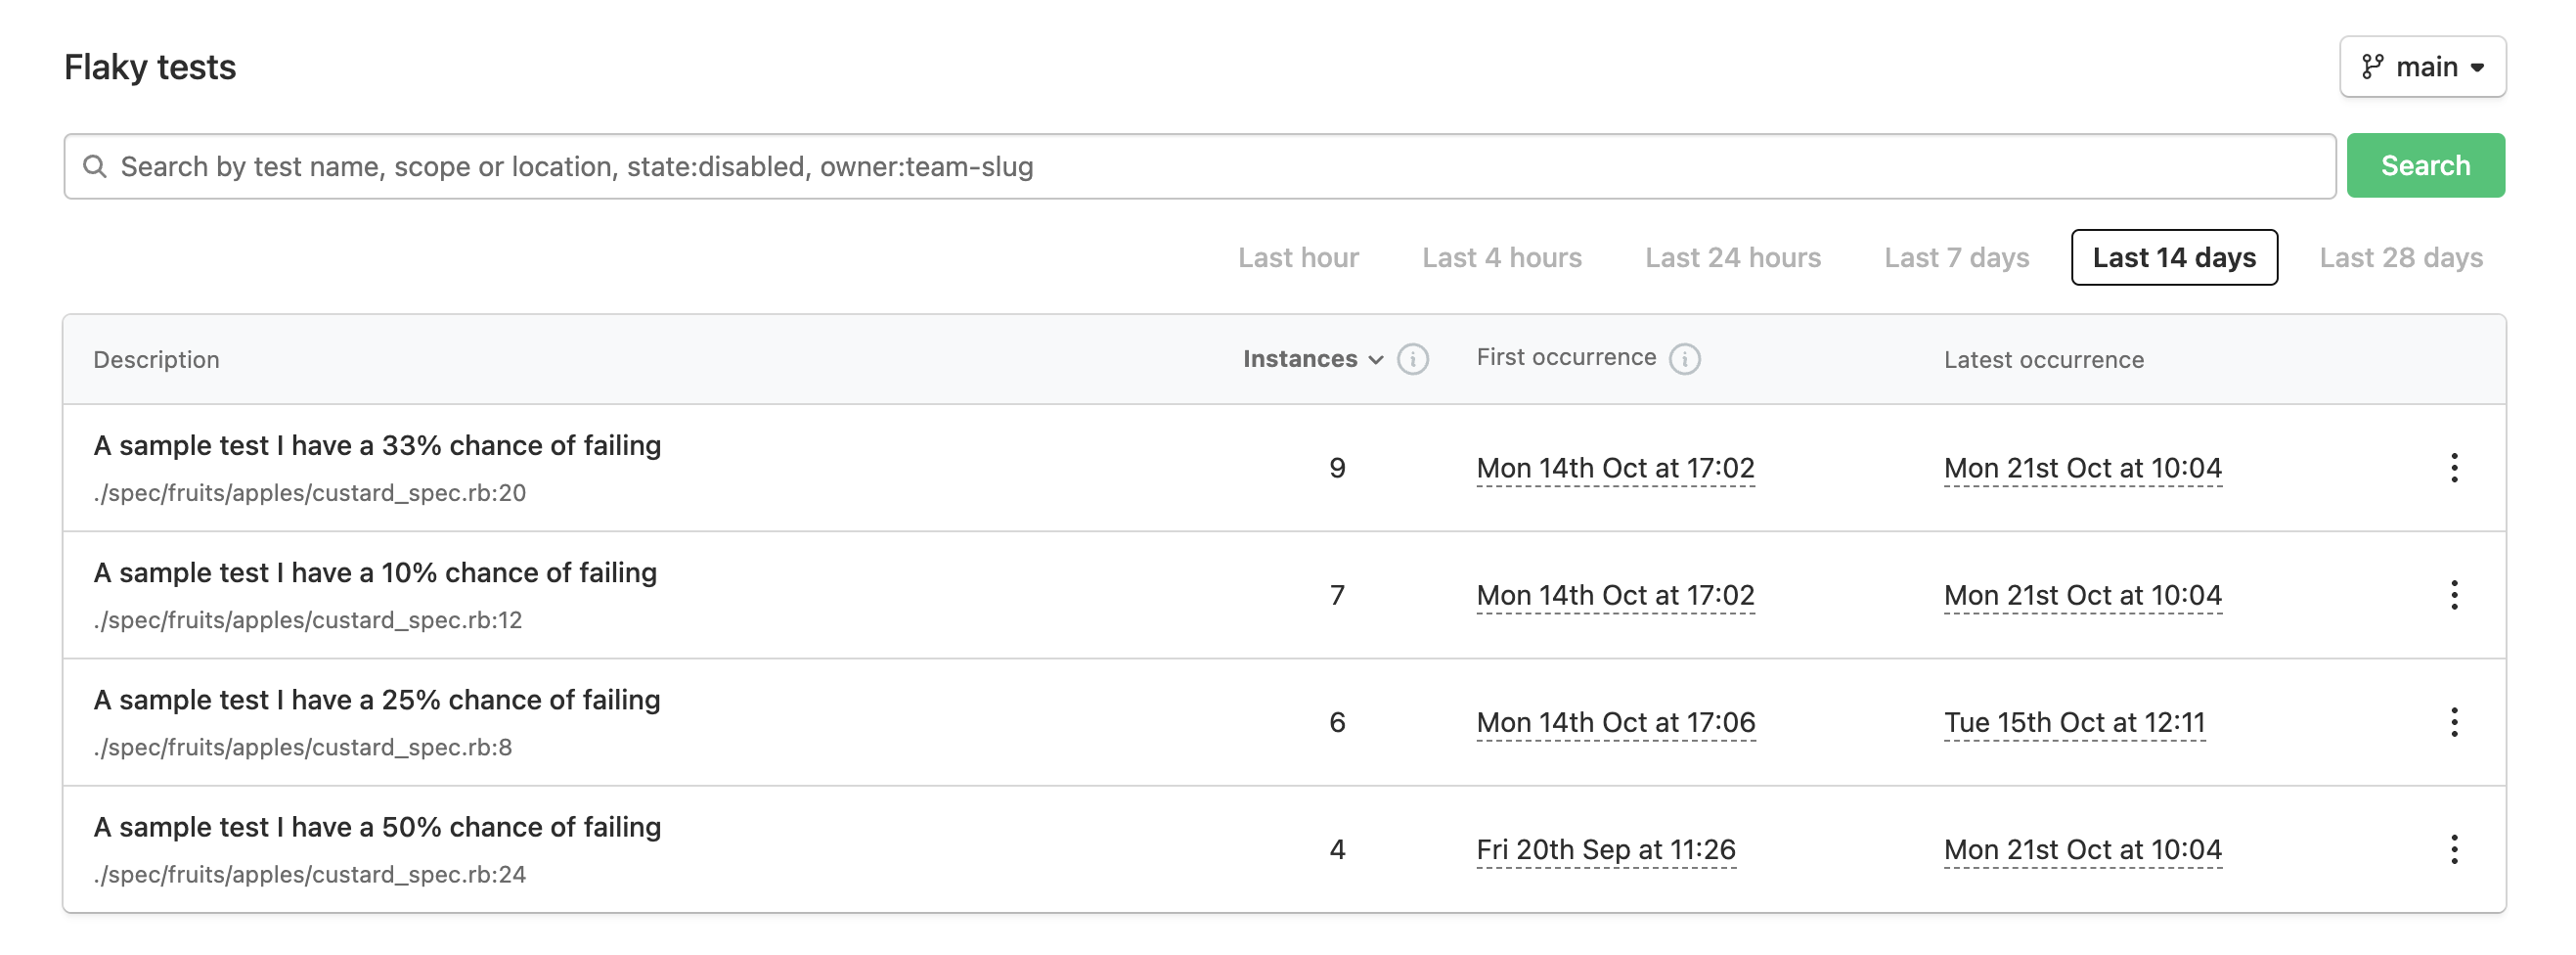
This enhancement provides greater insight into flaky tests, enabling users to identify recent test instability or track longer-term trends in test flakiness. Enjoy!
Katie
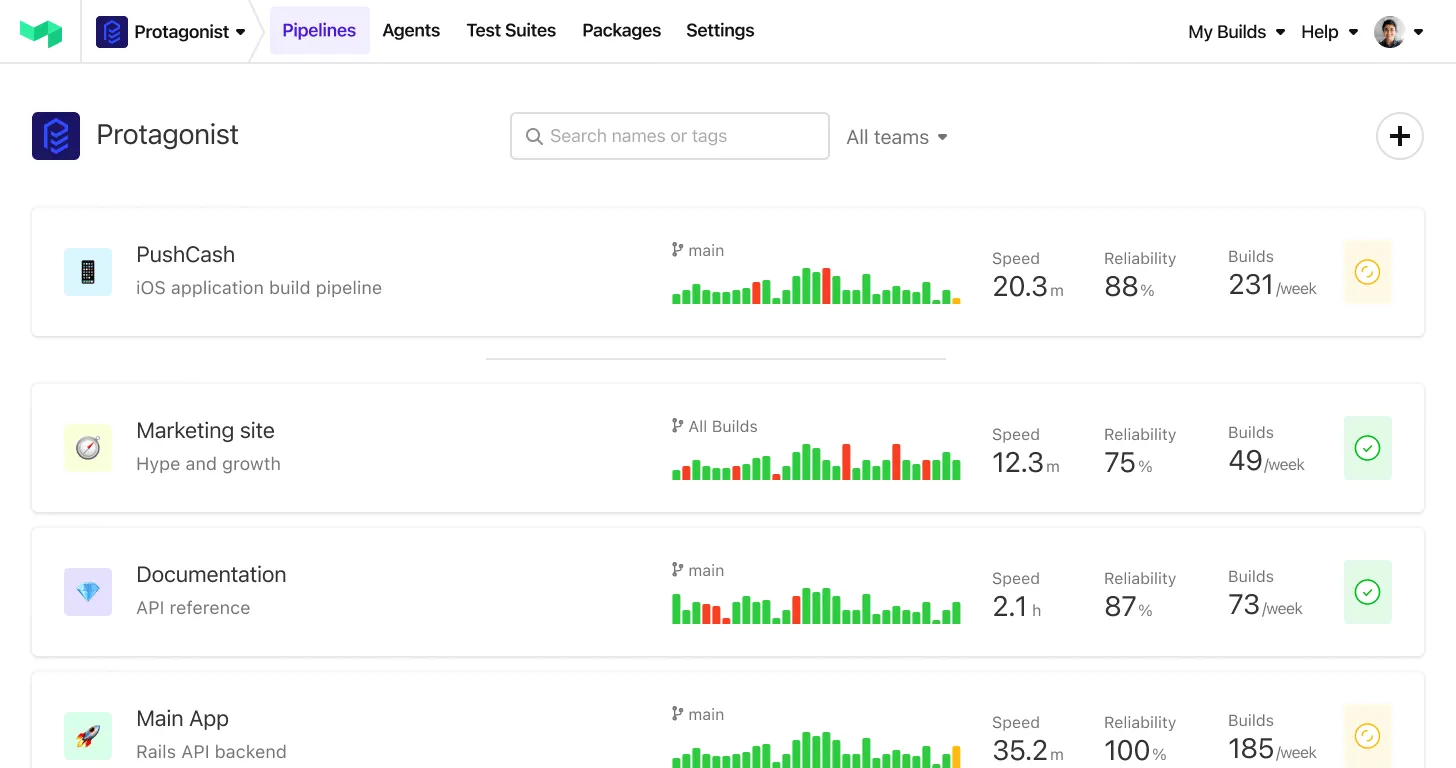
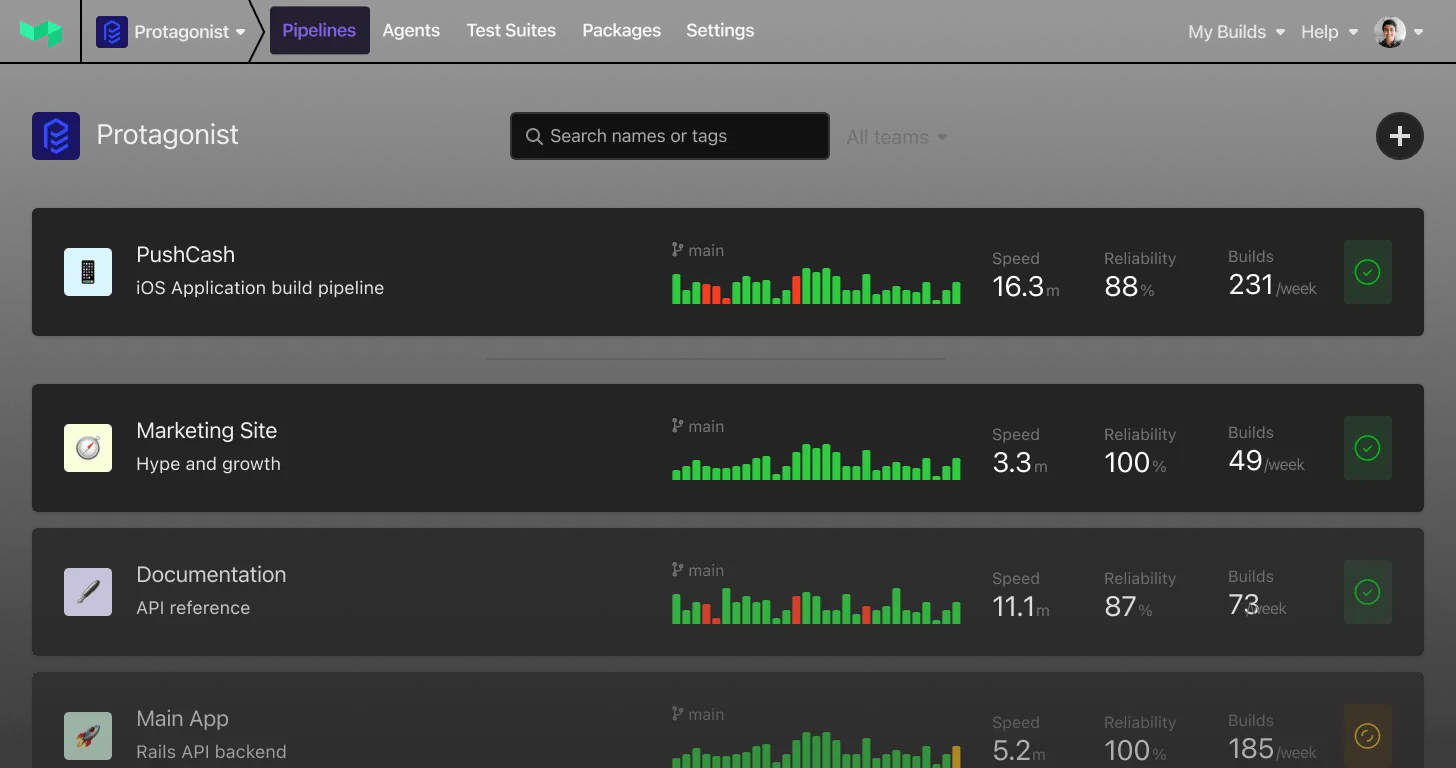
Dark mode
We’re excited to release dark mode for all customers!
In your user menu you can set Buildkite to display in light or dark mode, or adapt to your system theme:
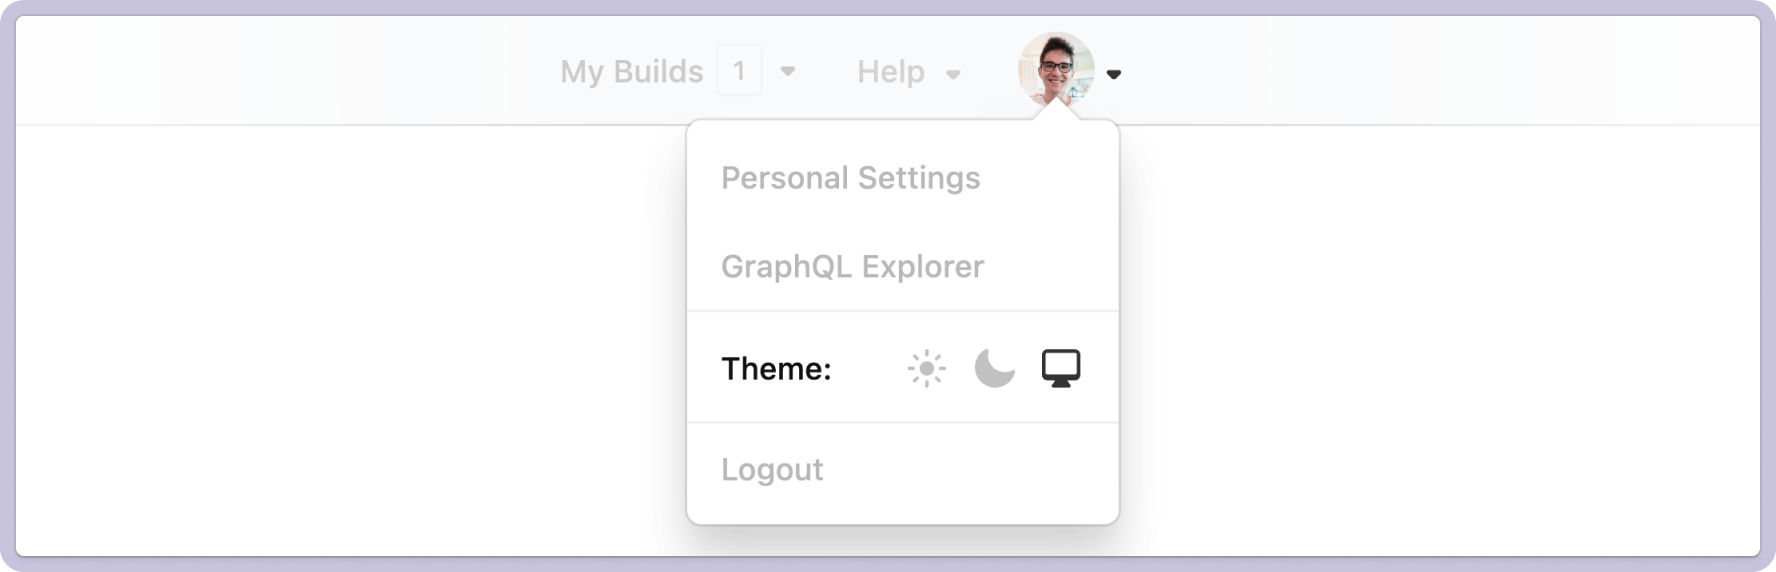
Thanks to all the customers whose input shaped this feature. Note that dark mode is experimental and you may encounter issues. Please reach out with any feedback or issues you notice, thanks!
Brett