- Resources
- /
- Changelog
Preview feature: View request logs for your OpenTelemetry Notification Service
The OpenTelemetry Notification Service now has a Request Log panel that is available in preview. This gives you more visibility into your trace exports and helps you diagnose connectivity, authentication, and endpoint configuration issues.
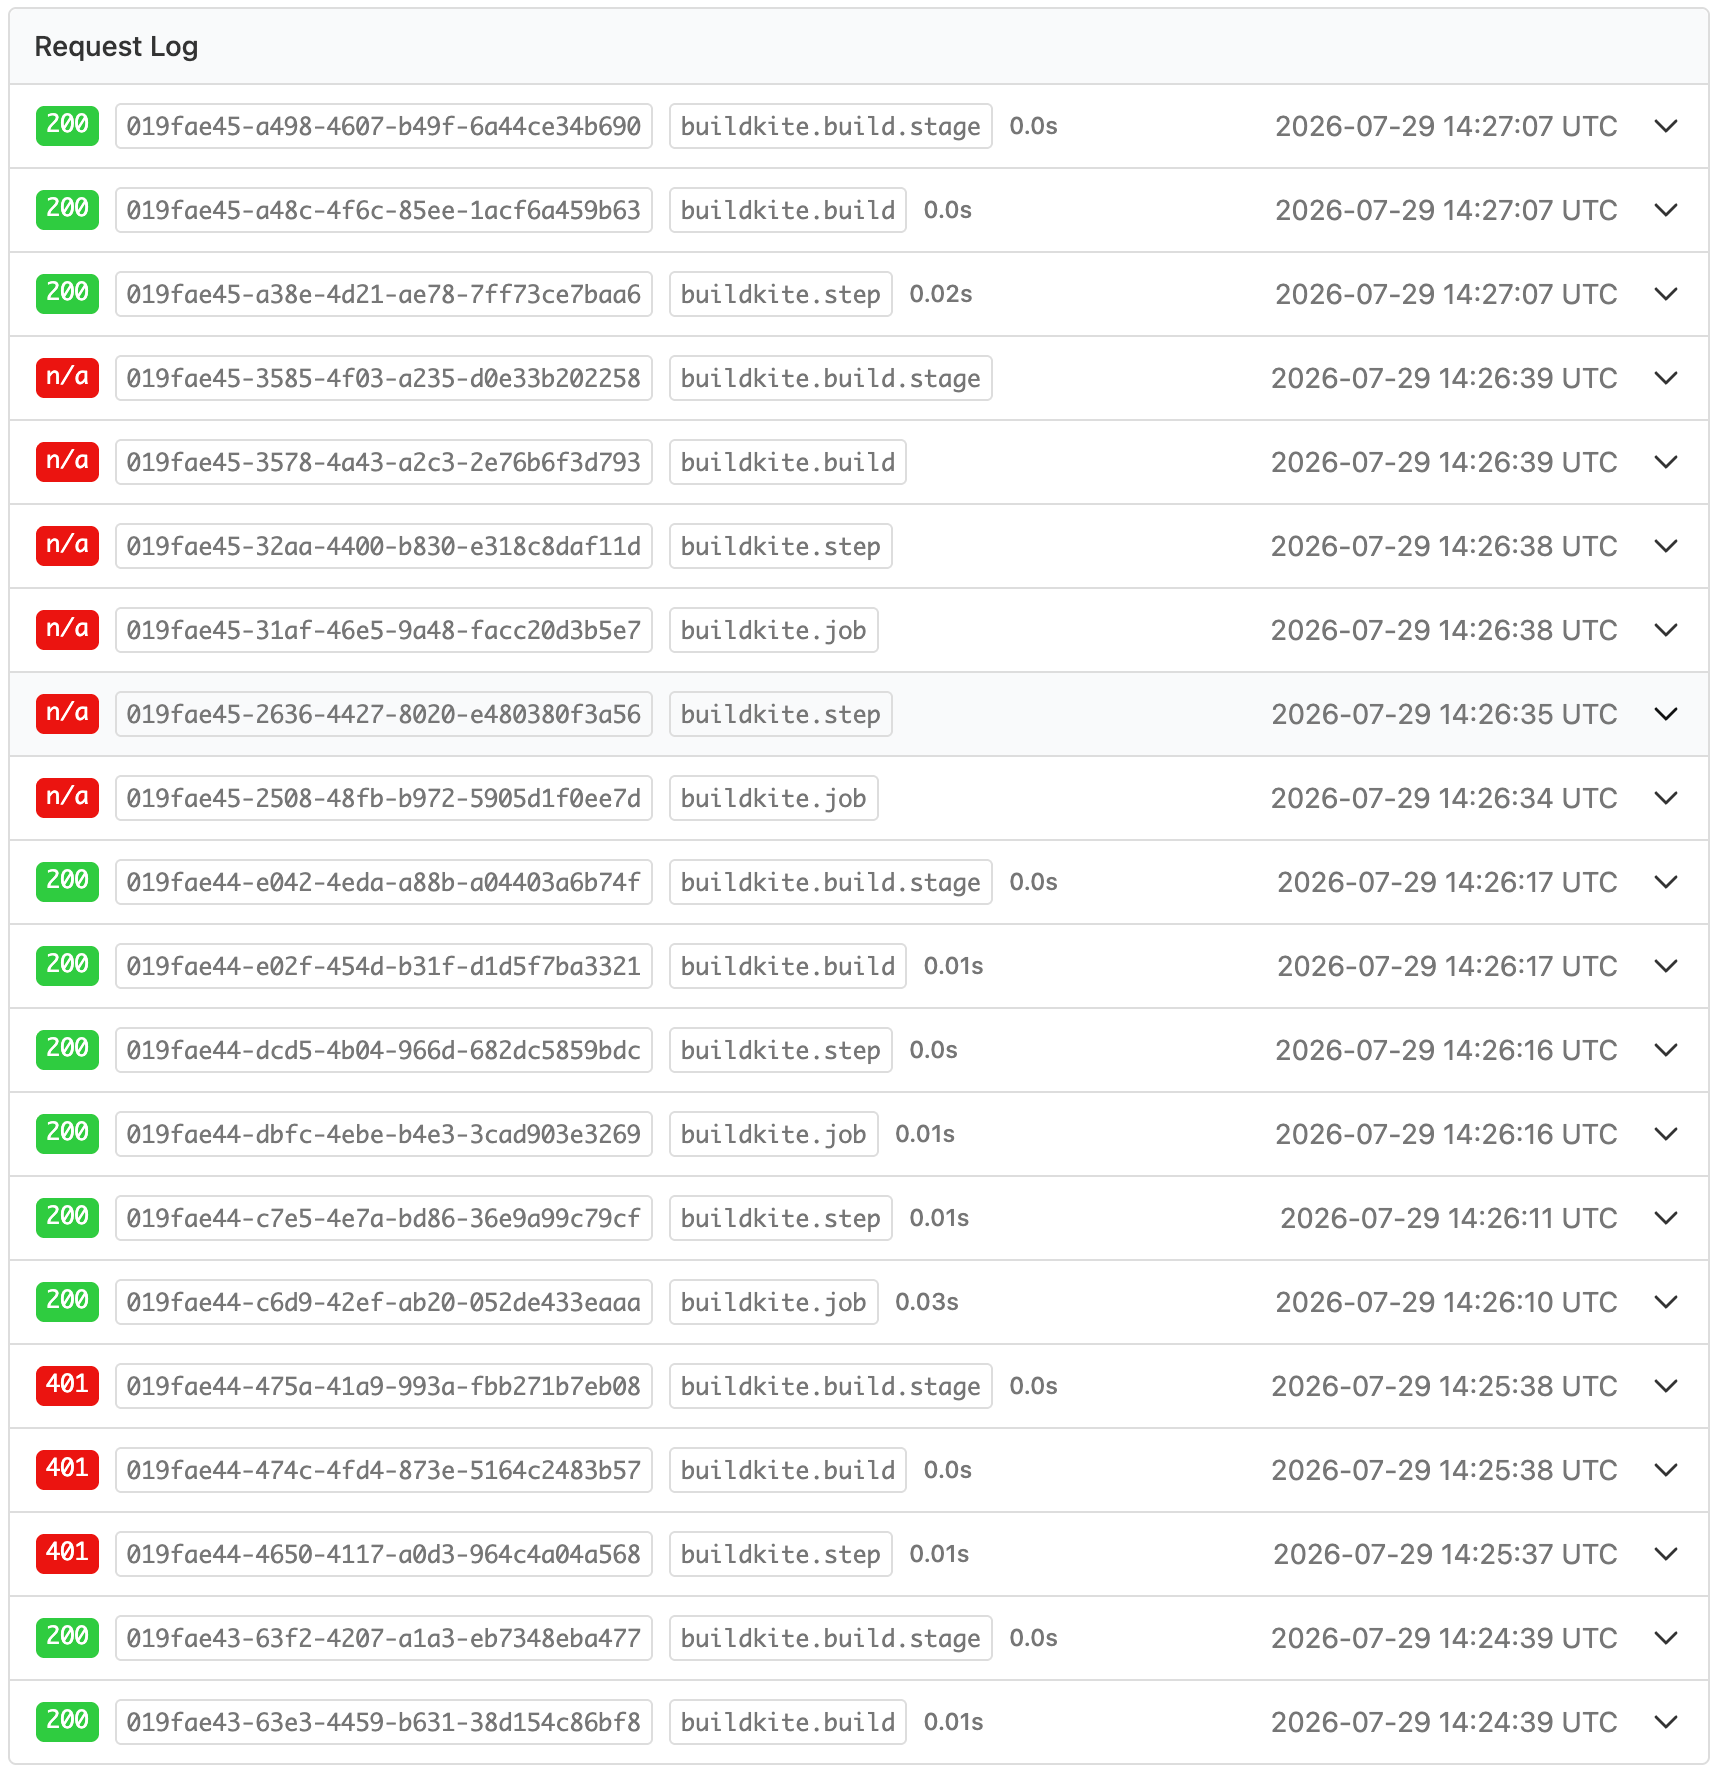
The panel shows the last 20 outbound trace export requests. Each row shows the request UUID and exported span name (for example, buildkite.job or buildkite.step). When the endpoint responds, the row also shows the HTTP status code and request duration. Expanding a row shows:
- Request: Headers and body. Custom header values, such as API keys and bearer tokens, are redacted. The OTLP protobuf body is decoded into readable JSON, with trace and span IDs shown in hexadecimal.
- Response: Headers and body, or an error message when no HTTP response is received. Protobuf responses, including any
partialSuccessrejections and error messages, are decoded into readable JSON.
This feature is in preview. Contact support@buildkite.com to have it enabled for your organization.
For more information, see the OpenTelemetry Request Log docs.
Tom
Buildkite MCP Server gives agents a fast path through failed builds
Debugging a failed build shouldn't start with a scavenger hunt. The Buildkite MCP Server now includes get_build_failure_summary, a new tool designed around Anthropic's best practices for writing tools for agents. It turns a common multi-step workflow into one purpose-built call, taking an agent from “the build failed” to a likely cause.
The tool brings together the build state, failed and broken jobs, useful log tails, error and warning annotations, and failed Test Engine executions. It even catches jobs that are still running but have already signaled that they'll fail. The result is deliberately bounded, giving the agent useful context without burying the conversation in logs.
When a failure needs a closer look, the agent can still follow up with the existing job, log, annotation, and test tools.
This is available in both the open-source MCP server and the Remote MCP server.
Ben
Ubuntu 24.04 is now available for Elastic CI Stack for AWS
The Elastic CI Stack for AWS now supports Ubuntu 24.04 LTS as an alternative to Amazon Linux 2023 for Linux agents. Ubuntu images are available for both x86-64 and ARM64 instances.
Ubuntu can be selected with either supported deployment method:
- For CloudFormation, set the
LinuxDistributionparameter toubuntu2404in Elastic CI Stack for AWS v6.70.0. - For Terraform, set
linux_distribution = "ubuntu2404"when using Terraform module v0.11.0.
Amazon Linux 2023 remains the default, so existing configurations continue to use it unless Ubuntu is explicitly selected.
Łukasz
Buildkite MCP Server adds skill guides and more efficient log search
The Buildkite MCP Server can now discover and load on-demand usage guides, and log searching is more efficient and reliable.
Discoverable skill guides for agents
Agents can now discover and load usage guides on demand, instead of relying solely on tool descriptions or the server's static instructions. Guides can be searched by keyword and loaded in full when needed, making it easier for an agent to find the right guidance for the task at hand. The first available guide covers debugging build failures, previously available only as a passive resource, and now discoverable and loadable directly by an agent.
More efficient, reliable log search
Searching build logs is now more token-efficient, cutting response size by roughly 40% in testing by trimming repeated, redundant data from each result. We've also fixed a few edge cases so log searches behave more predictably, including where a search starts from and how row numbers are reported.
These improvements apply to both the open-source MCP server and the Remote MCP server.
Mark
Test GitLab merge requests before they merge
Teams using GitLab.com or GitLab Self-Managed can now build merge requests and test proposed merges against their target branches with merged-results builds. Merge request builds test the source branch, while merged-results builds test the proposed merge, helping catch integration failures before merging.
Set up merge request builds
In your pipeline's GitLab settings:
- Enable Build merge requests to build a merge request when it opens or receives new commits. If Build branches is also enabled, Buildkite avoids creating a duplicate branch build for an active merge request.
- Optionally, enable Build merged results commit to test the proposed merge with its target branch instead of testing the source branch alone.
- If your target branch changes frequently, enable Rebuild when target branch changes to keep merged-results builds up to date.
To control build volume when a target branch changes, Buildkite rebuilds up to the 20 most recently created affected merge requests.
These settings are also available through the REST API. See the GitLab documentation to learn more.
Hannah
Test Engine mutable tags
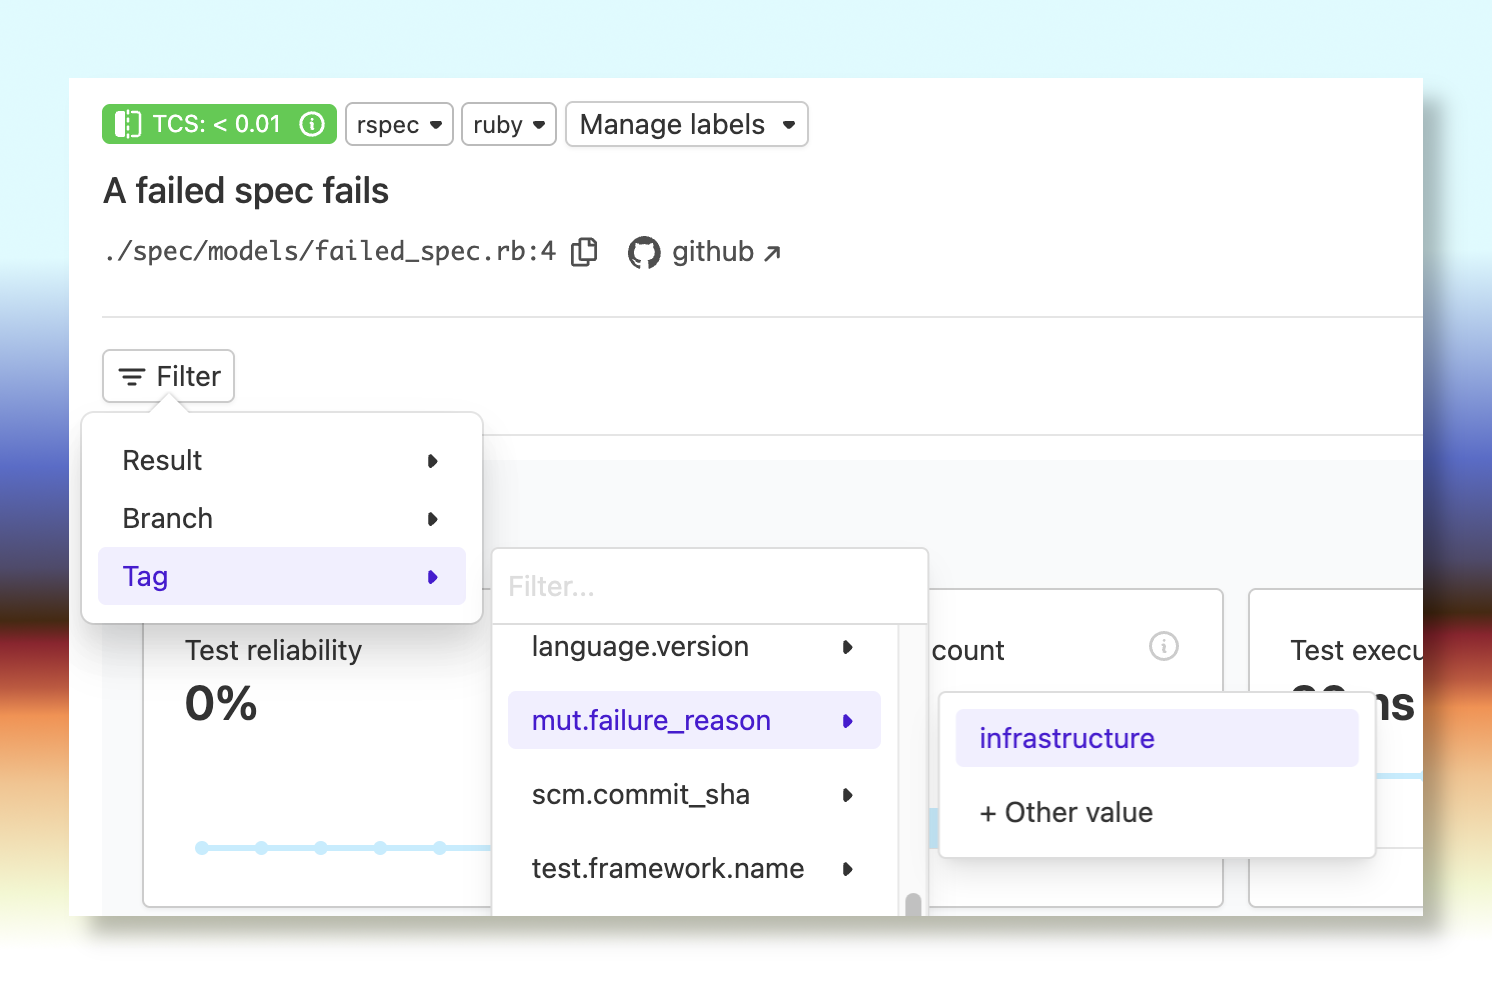
Test execution results uploaded to Test Engine are immutable, and so cannot be updated after initial upload. To allow metadata to be attached to execution records after upload we have introduced mutable tags.
Additional tags can be attached to executions in bulk via the execution tags API endpoint.
Mutable tags must use the reserved mut. prefix, and can be used in filters in the same way as immutable tags.
Malcolm
OAuth application authorizations now appear in the audit log
Organization administrators can now see when a user authorizes an OAuth application to access their organization in the Buildkite audit log.
Each OAUTH_APPLICATION_AUTHORIZED event identifies the user, OAuth application, organization, granted scopes, request IP address, and User Agent. This provides a clearer record of when tools using OAuth—such as the Buildkite CLI and Remote MCP Server—are granted access.
Refreshes of an existing OAuth authorization do not create duplicate authorization events.
Ben
Buildkite MCP Server adds job tools and smarter artifact and log handling
The Buildkite MCP Server has new tools for working with jobs, smarter artifact and log handling, and more scalable pagination for large builds and test runs.
Dedicated tools for inspecting jobs
Agents can now look up job details directly with list_jobs and get_job, filter by state (for example, only failed jobs), page through large builds efficiently, and pull full agent details only when needed. This makes it much faster for an agent to zero in on "why did this build fail?" without wading through unrelated build metadata. list_agents and get_agent also now include os_id, arch, and queue by default, so agents can see where a job is running without requesting the full, token-heavy agent response.
Note: get_build and list_builds no longer return job data, and no longer accept detail_level, job_state, or include_agent — use list_jobs or get_job to fetch jobs instead. Your MCP client picks up the updated tool definitions automatically, so there's nothing to reconfigure.
Safer, more efficient artifact downloads
Artifacts now come back the smart way: small text files (under 64 KiB) are returned inline immediately, while larger or binary files get a temporary, ready-to-use download link, no API token juggling required. Listing artifacts across a build is also much lighter now, roughly halving the amount of data returned on large builds, so agents spend less time and budget just listing files before getting to the one they actually need.
Note: list_artifacts_for_build and list_artifacts_for_job no longer include download_url, url, dirname, glob_path, or original_path on each item. Use get_artifact with the id and job_id from a list result to fetch an artifact's content or download URL.
More scalable test result retrieval
Fetching failed test executions from large test runs now paginates properly against the Buildkite API, instead of pulling everything back at once. This means agents can work through large test suites reliably rather than hitting limits on big runs.
More reliable log handling
Under-the-hood improvements to log parsing make searching and tailing build logs more robust against messy or unusually large log output, with fewer dropped or malformed lines when an agent is digging through logs to debug a build.
Better resilience to rate limits
The server now handles Buildkite API rate limiting more gracefully, automatically retrying with proper backoff instead of failing outright. Agents should see fewer transient errors during heavy usage.
These improvements apply to both the open-source MCP server and the Remote MCP server.
Mark
Track the performance of your hosted agents
There's a new Metrics tab on every job that runs on Buildkite hosted agents, giving you a live view of how that job used its machine. No dashboards to wire up, no agent configuration — open a job and the charts are right there.
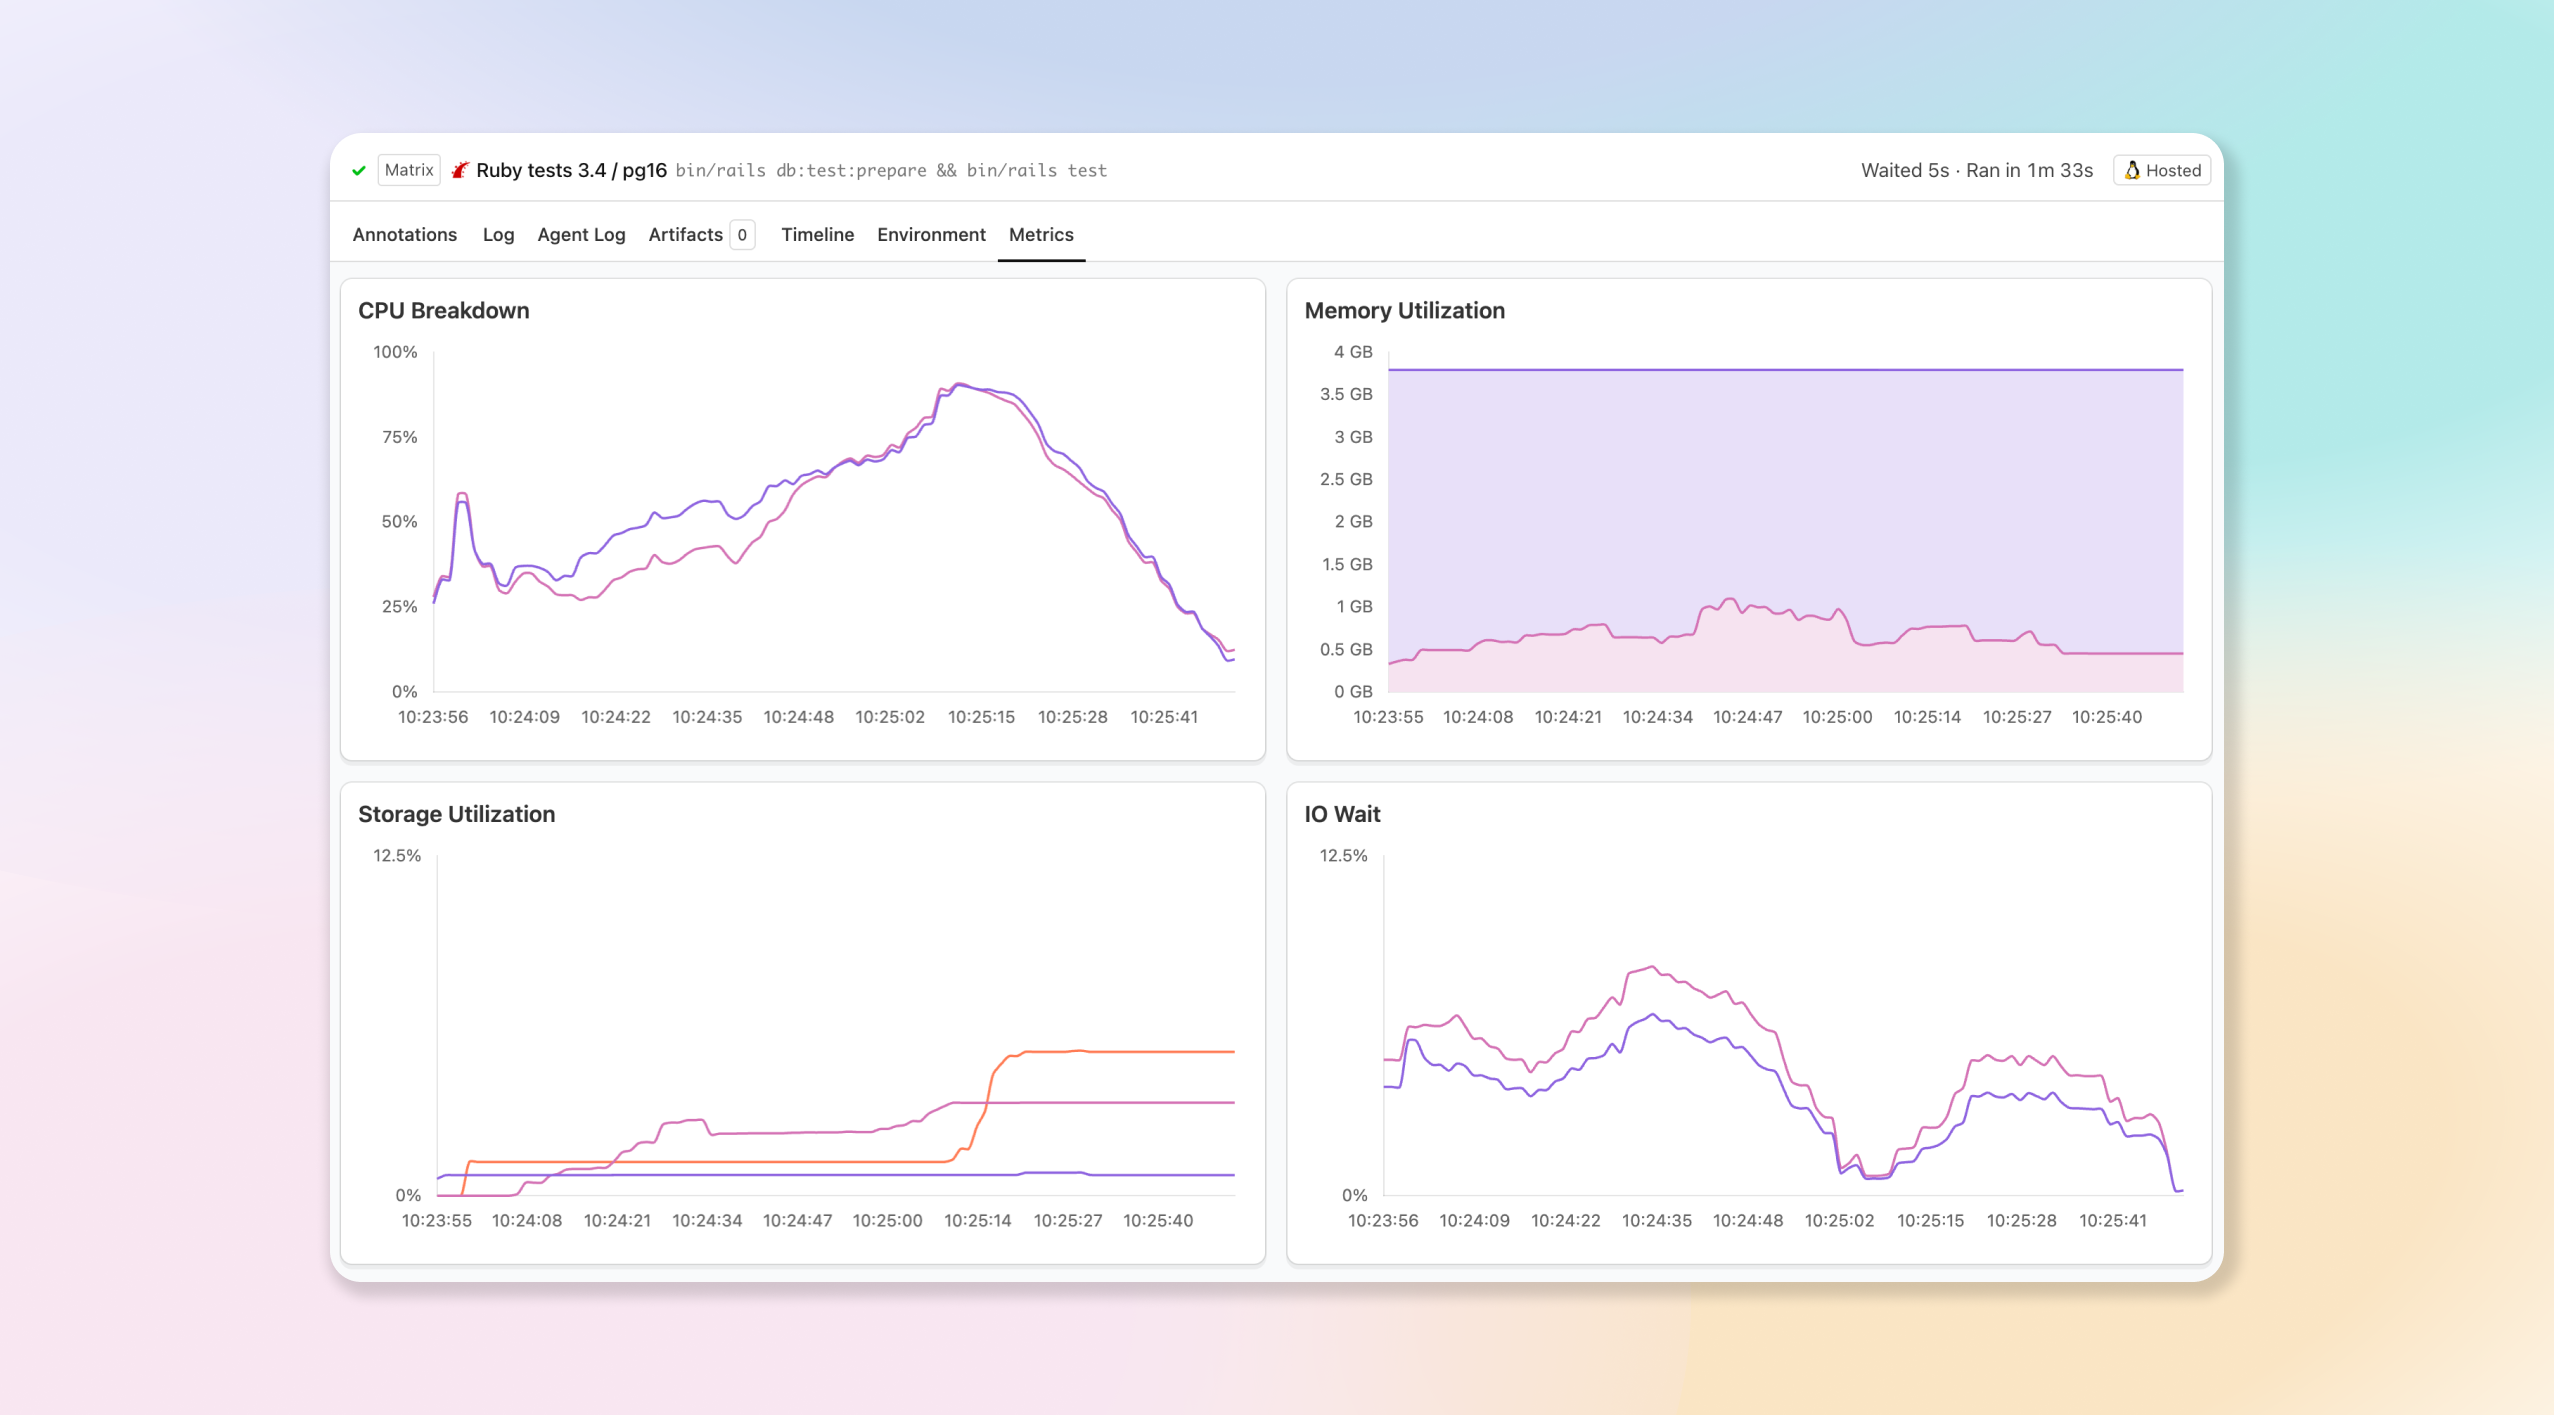
- Measure CPU load: See how hard the machine worked over the life of the job, so you can spot steps that are starved for CPU or right-size an oversized instance.
- Watch memory utilization: Track memory usage across the job to catch the spikes that lead to out-of-memory failures before they bite.
- Keep an eye on storage: Follow disk utilization over time to find jobs that are filling up the instance.
- Spot IO wait (Linux): On Linux instances, an extra chart surfaces time spent waiting on IO, making it easy to tell a disk-bound job apart from a CPU-bound one.
- Updates live as the job runs: The charts stream in while the job is still running and settle into a complete picture once it finishes, so you don't have to wait for the build to end to start investigating.
Use it to debug slow or failing jobs, right-size your hosted instances, and understand where your build minutes are actually going. Available now on jobs running on hosted agents — open any job and select the Metrics tab.
Gabe
REST API job endpoints for large builds
You can now fetch jobs separately from builds in the REST API, making large matrix or high-parallelism builds easier to query.
List builds without embedded jobs:
GET /v2/organizations/:org/pipelines/:pipeline/builds?exclude_jobs=trueThen fetch only the jobs you need:
# List jobs for one build, with filtering and pagination
GET /v2/organizations/:org/pipelines/:pipeline/builds/:build/jobs?state[]=failed&include_retried_jobs=false&per_page=100

# Fetch one job from a build
GET /v2/organizations/:org/pipelines/:pipeline/builds/:build/jobs/:uuid

# Fetch one job directly by UUID
GET /v2/organizations/:org/jobs/:uuid
Use exclude_jobs=true by default when listing builds unless you need embedded jobs, then use the jobs endpoints for targeted access.
See the REST API jobs documentation for endpoint details and examples.
Buildkite
Remote MCP Server API access token support is now available (Preview)
A preview of Buildkite API access token authentication for the Buildkite Remote MCP Server is now available through a dedicated endpoint: https://mcp.buildkite.com/direct.
Use this endpoint for headless or background agents that already have a Buildkite API access token and do not need the interactive OAuth flow. This helps avoid contention around shared OAuth tokens when multiple background agents are running at once.
Pass the token using the standard Authorization: Bearer header. Buildkite enforces the token's scopes on each API request, so use a token with the minimum access your agent needs.
The existing OAuth endpoint at https://mcp.buildkite.com/mcp is unchanged and remains the default for interactive MCP clients. The /direct endpoint supports the same toolset and readonly routing options, including /direct/readonly and /direct/x/{toolset}/readonly.
This feature is currently in preview. If you run into issues or have feedback, please reach out to support@buildkite.com.
Mark
Buildkite MCP Server adds cluster, build, and schedule management tools
The Buildkite MCP Server can now do more than read from Buildkite. It can take action across clusters, builds, jobs, and pipeline schedules.
New cluster and queue management tools let agents list, inspect, create, and update Buildkite clusters and cluster queues, and pause or resume queue dispatch. These are gated behind the read_clusters and write_clusters toolsets.
Agents can now cancel a running build, rebuild a completed one, retry a specific failed job, and read a job's environment variables with get_job_env. These write operations are gated behind the write_builds toolset.
Pipeline schedule tools now support listing, inspecting, creating, and updating schedules, so agents can manage scheduled builds directly from your MCP client.
The new list_agents and get_agent tools show which Buildkite agents are connected and their current state.
The server also ships with built-in instructions for MCP clients, helping agents use the tools more reliably.
get_artifact now uses structured identifiers instead of a URL. It takes org_slug, pipeline_slug, build_number, job_id, and artifact_id, which map directly onto the output of list_artifacts_for_build and list_artifacts_for_job, so the tools chain together without needing to parse a URL.
These improvements apply to both the open-source MCP server and the Remote MCP server.
Mark
Dynamically update job timeouts with `buildkite-agent job update`
You can now update a job's timeout at runtime using the new buildkite-agent job update command. If a job discovers mid-run that it needs more (or less) time, it can adjust its own timeout without requiring a pipeline change.
$ buildkite-agent job update timeout 20This sets the job's timeout to 20 minutes. You can also pipe the value from stdin:
$ echo 20 | buildkite-agent job update timeoutThe command targets the current job by default (via $BUILDKITE_JOB_ID), or you can specify a job explicitly with --job <id>.
How it works
buildkite-agent job update follows the same pattern as the existing buildkite-agent step update command, but operates at the job level. The attribute and value are validated server-side, which means new attributes can be introduced in future without requiring an agent release.
Timeouts are enforced by the Buildkite server and may take up to 2 minutes to take effect after the command runs. Only command jobs can be updated, and only while they are still running.
This is useful when a job has information at runtime that wasn't available when the pipeline was defined — for example, detecting that a test suite is larger than expected and needs more time, or that it's smaller and should fail sooner to avoid tying up agent capacity unnecessarily.
For more information, see the Buildkite Agent CLI reference.
Matthew
New `tests` plugin for running your test suites
The new tests Buildkite plugin is the easiest way to run your test suites on Buildkite. Add the plugin to your step and set its command to bktec run, and bktec (Buildkite Test Engine client) splits your tests across parallel jobs out of the box. You also get test analytics, flaky test detection, timing, and history, with nothing extra to wire up.
steps:
  - label: "RSpec"
    command: bktec run
    parallelism: 4
    plugins:
      - tests#v1.0.0:
          test-runner: rspec
          result-path: tmp/rspec-result.json
The plugin works with every runner bktec supports, including RSpec, Jest, Cypress, Playwright, pytest, gotest, Cucumber, and NUnit.
Analytics out of the box
With bktec v2.7.0, the plugin uploads test results by default, so there is no separate test collector to install or configure. You get flaky test detection, per-test timing, and failure history from the first build. This can be disabled if you prefer to use a test collector instead.
Zero setup
The plugin handles everything behind the scenes:
- Downloads
bktecand makes it available to the step (can be disabled if you prefer to install it yourself) - Generates a short-lived OIDC token for authentication, so there are no API tokens to rotate
- Creates the test suite from the pipeline on the first run if it doesn't exist
- Exposes all
bktecoptions as plugin attributes, so you don't need to manage environment variables yourself
Get started
Add the plugin to any step that runs bktec run or bktec plan. See the plugin README for the full list of options.
Naufan
Upload test results directly with bktec and the Upload API
You can now upload test results directly to Test Engine, either through bktec v2.7.0's new upload option, or by pushing raw output yourself via the Upload API. Test collectors are still supported, but they're no longer a hard dependency.
bktec v2.7.0 - direct result uploads
bktec v2.7.0 adds a new BUILDKITE_TEST_ENGINE_UPLOAD_RESULTS option and --upload-results flag to upload your test runner's raw output straight to the Upload API. You can also tag uploads with key/value pairs to filter and group results in Test Engine.
See the bktec README for details.
Upload API - native output support
The Upload API now accepts native JSON output from RSpec, Cucumber, Jest, and Playwright directly, without any format conversion.
- RSpec (
rspec-json) - Cucumber (
cucumber-json) - Jest (
jest-json) - Playwright (
playwright-json)
Naufan
OIDC authentication in Test Engine
Test Engine now supports OIDC token authentication for test collectors and bktec.
An OIDC policy must be set on any suite using OIDC authentication, specifying which pipelines are permitted access to the suite.
Test Collectors
It's now possible for test collectors to use temporary OIDC tokens to authenticate test result uploads.
bktec
As of version 2.6.0, the Buildkite Test Engine Client (bktec) supports generating short lived OIDC tokens for authentication with Test Engine.
bktec has previously required two authentication environment variables to be set on builds, BUILDKITE_TEST_ENGINE_API_ACCESS_TOKEN and BUILDKITE_ANALYTICS_TOKEN.
Both of these are now optional.
bktec will generate an OIDC token if either is missing.
- If the previously mandatory environment variable
BUILDKITE_TEST_ENGINE_API_ACCESS_TOKENis not set ,bktecwill generate an OIDC token to communicate with the test splitting API. - If the environment variable
BUILDKITE_ANALYTICS_TOKENis not set,bktecwill generate an OIDC token and setBUILDKITE_ANALYTICS_TOKENwith it's value when invoking the test runner. Test collectors use this environment variable by default to authenticate test result uploads. - Token lifetime is 2 hours by default, and can be controlled with the
--oidc-lifetimeflag. - OIDC token generation can be disabled with the
--no-oidcflag.
Further reading
Malcolm
OAuth Token Exchange: short-lived API tokens from your identity provider

Buildkite now supports OAuth 2.0 Token Exchange (RFC 8693), letting you mint short-lived Buildkite API tokens on behalf of your user directly from your identity provider (IdP). Instead of managing long-lived API tokens, your identity provider tooling can exchange a signed JWT for a scoped, time-limited Buildkite token — no secrets to store, rotate, or worry about leaking.
How it works

First, set things up once: generate a keypair in your infrastructure, keep the private key with your tooling for signing JWTs, and publish the public key on a JWKS (JSON Web Key Set) host. Then register a token exchange application in your Buildkite organization settings, point it at your JWKS (inline or via URI), and configure the grantable scopes, maximum TTL, and any IP restrictions for minted tokens.
From there, each token exchange follows three steps:
- Your tooling signs a JWT with its private key and sends it to Buildkite's
/oauth/tokenendpoint. - Buildkite fetches your JWKS to verify the JWT's signature against your published public key.
- Buildkite mints a short-lived
bktx_token scoped within the limits of your token exchange application and returns it to your tooling. Every mint is recorded in the audit log against the application, user, and key ID.
curl -X POST https://api.buildkite.com/v2/oauth/token \
  -d grant_type=urn:ietf:params:oauth:grant-type:token-exchange \
  -d client_assertion_type=urn:ietf:params:oauth:client-assertion-type:jwt-bearer \
  -d client_assertion=$SIGNED_JWT \
  -d audience=your-org-slug \
  -d subject_token=$USER_EMAIL \
  -d subject_token_type=urn<img class="emoji not-prose size-4 inline align-[-0.1em]" title="buildkite" alt=":buildkite:" src="https://buildkiteassets.com/emojis/img-buildkite-64/buildkite.png" draggable="false" />params:oauth:token-type:user-email \
  -d scope="read_builds read_pipelines"
Key details
- Short-lived by design: Tokens expire automatically based on the TTL you configure (or request per-exchange), so leaked credentials are already expired.
- Scoped access: Each token exchange application defines grantable and default scopes, and callers can request a subset per token.
- IP restrictions: Lock down token exchange requests and minted tokens to specific source IP ranges.
- Full audit trail: Every token minted is logged as an audit event, tied to the token exchange application, user, and public key ID.
- JWT private key rotation support through JWKS URI: Point to your IdP's hosted JWKS endpoint and Buildkite will fetch and cache public keys associated with your JWT private key automatically, including support for key rotation.
- Rate limited: Organization-level rate limiting protects against abuse.
OAuth Token Exchange is available on Enterprise plans. To get started, see the OAuth Token Exchange docs, visit your organization's settings, or reach out to your account team.
Sorcha
Official Buildkite skills for AI coding agents
Buildkite skills are now available for Claude Code, Cursor, and other AI coding agents. Skills are short, agent-readable guides that teach an agent how to use Buildkite: pipeline conventions, the shape of our APIs, and the patterns we recommend for things like dynamic pipelines, OIDC federation, and CI migrations.
Install them with one command:
npx skills add buildkite/skillsSkills sit alongside the docs rather than replacing them. Where docs explain what a Buildkite feature does, a skill teaches an agent how to use it well: recommended patterns, common mistakes, and the judgement calls an experienced user makes.
What's in the repo today
- buildkite-pipelines: designing a pipeline, tuning caching, debugging builds, generating dynamic steps, and running matrix builds
- buildkite-agent-runtime: annotating builds, uploading and fetching artifacts, passing data between steps, uploading dynamic steps from inside a job, and federating with cloud providers via OIDC
- buildkite-cli: triggering and inspecting builds from your terminal, managing pipelines and secrets locally, and scripting against Buildkite
- buildkite-api: automating Buildkite from your own systems, building integrations, querying build data at scale, and reacting to events with webhooks
- buildkite-migration: planning a move to Buildkite from GitHub Actions, Jenkins, CircleCI, Bitbucket Pipelines, or GitLab CI, and converting existing pipeline YAML
- buildkite-preflight: validating local pipeline changes against real CI before you push
Contributing
The repo welcomes contributions: patterns from your own pipelines, gotchas you've hit in production, and corrections to anything wrong or out of date. See github.com/buildkite/skills for installation instructions for individual agents and contribution guidelines.
Product
Trigger pipelines from more GitHub events
Buildkite pipelines can now be triggered by a much broader set of GitHub webhook events — not just pushes and pull requests. This makes it easier to migrate GitHub Actions workflows to Buildkite incrementally, without losing triggers along the way.
New event triggers
You can now trigger pipeline builds from:
- Pull request reviews — run builds when a review is submitted or dismissed
- Check runs — react to completed check runs from other GitHub Apps, with built-in loop prevention for Buildkite's own checks
- Releases — trigger builds when a GitHub release is published, created, or released
- Issue comments — kick off builds from PR comments, with configurable command word filtering (supports
exactandcontainsmatch modes) - Pull request review comments — trigger builds from inline diff comments, with the same command word and match mode support (useful for AI assistant triggers like
@claude) - Deployment statuses — build when a deployment status changes
- Branch and tag creation — trigger on
createevents for new branches or tags
Expanded pull request actions
Pull request triggers now support additional actions beyond opened and synchronize:
Builds can now be triggered by edited, reopened, converted_to_draft, review_requested, and dequeued actions, in addition to the existing ready_for_review, labeled, and unlabeled actions.
Disable all webhooks
You can now disable all GitHub webhook-triggered builds for a pipeline with a single button. Select Disable GitHub Webhooks in your pipeline's GitHub settings to stop all webhook processing. Your existing trigger settings are preserved and restored when you re-enable.
Better filtering
GitHub webhook-triggered builds also now include BUILDKITE_GITHUB_EVENT and BUILDKITE_GITHUB_ACTION environment variables, available at runtime and in build.env() conditionals. These are also included as new conditional variables to make it easy to write fine-grained build filters:
build.source_event— the GitHub event type (e.g.push,pull_request,release)build.source_action— the event action (e.g.labeled,opened,submitted)
We've also added build.pull_request.label, which allows for filtering on the specific label that was just added or removed, rather than the whole set of labels.
All the new events expose relevant context as environment variables via build.env() that you can use in pipeline and step conditionals. This allows for more fine-grained filtering before you start running builds and steps.
Learn more about configuring GitHub webhook triggers in our documentation.
Hannah
Search queues within a cluster
You can now search for queues by name on the cluster queues page, making it much faster to find a specific queue when your cluster contains hundreds of them.
- Find queues quickly: Type any part of a queue name to filter the list instantly, with case-insensitive substring matching so you don't need to remember the full name or exact prefix.
- Fast, in-page updates: Results update in place as you search, without full-page reloads, and pagination continues to work across filtered results.
- Scales to large clusters: Built for customers consolidating many queues into a single cluster as part of a cluster migration, where scanning a paginated list is no longer practical.
Chris
Start turning complexity into an advantage
Create an account to get started for free.