Preview feature: View request logs for your OpenTelemetry Notification Service
The OpenTelemetry Notification Service now has a Request Log panel that is available in preview. This gives you more visibility into your trace exports and helps you diagnose connectivity, authentication, and endpoint configuration issues.
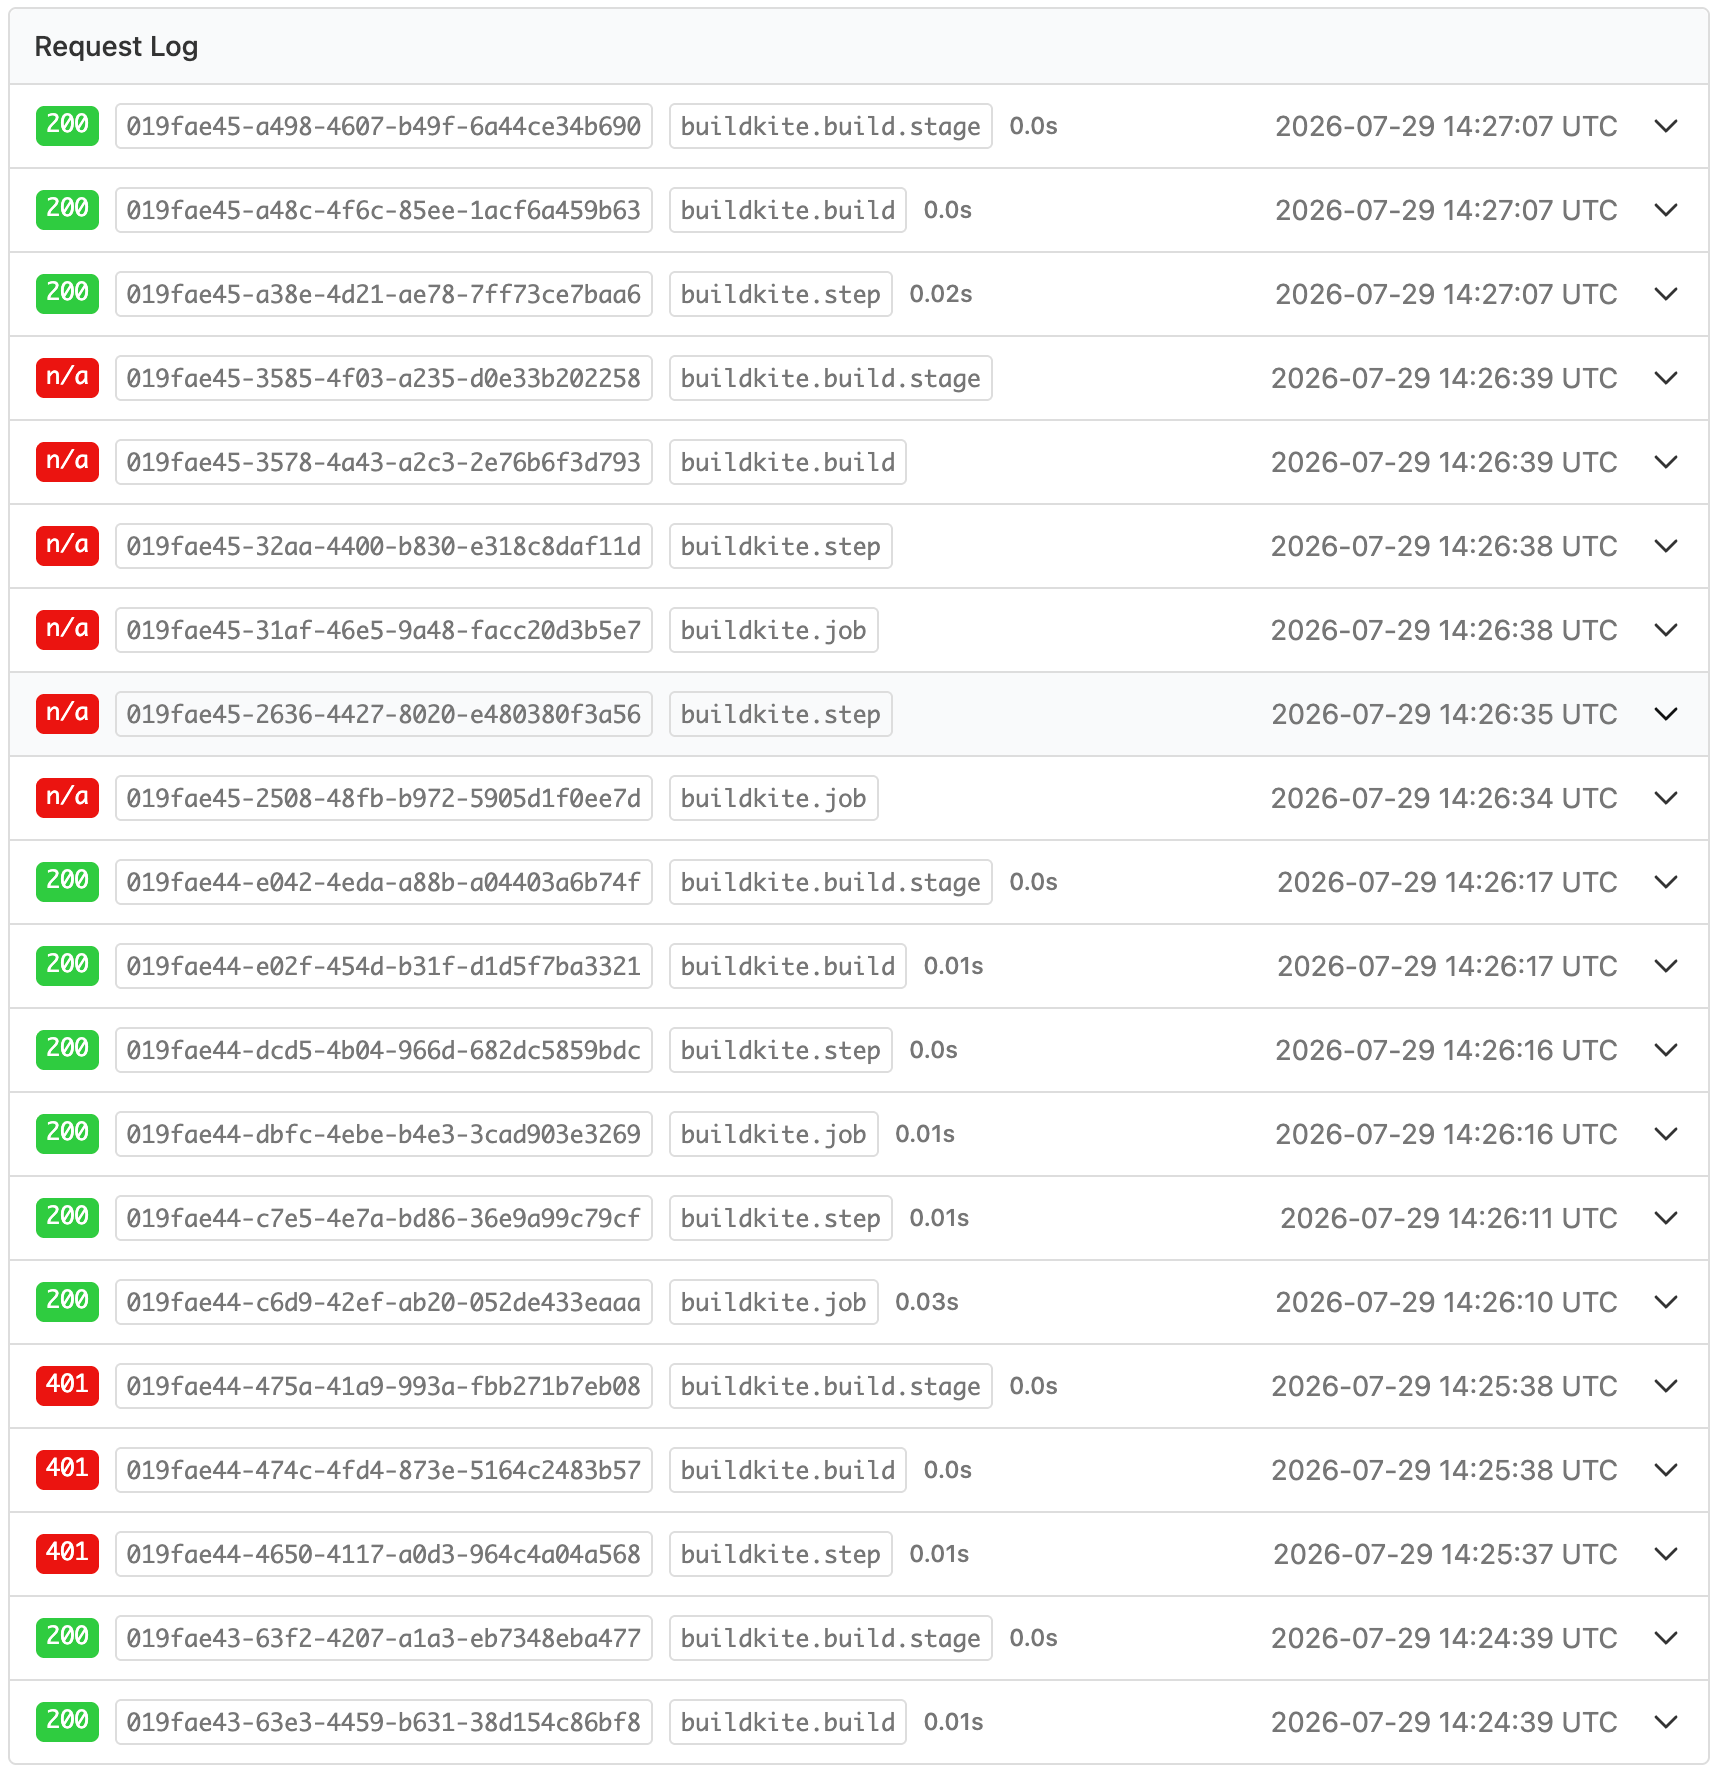
The panel shows the last 20 outbound trace export requests. Each row shows the request UUID and exported span name (for example, buildkite.job or buildkite.step). When the endpoint responds, the row also shows the HTTP status code and request duration. Expanding a row shows:
- Request: Headers and body. Custom header values, such as API keys and bearer tokens, are redacted. The OTLP protobuf body is decoded into readable JSON, with trace and span IDs shown in hexadecimal.
- Response: Headers and body, or an error message when no HTTP response is received. Protobuf responses, including any
partialSuccessrejections and error messages, are decoded into readable JSON.
This feature is in preview. Contact support@buildkite.com to have it enabled for your organization.
For more information, see the OpenTelemetry Request Log docs.
Tom
You deserve better CI.
Get started for free with a full month of our all-access trial.