Lengthy console output logs in Jenkins can be a nightmare to sift through — like looking for a needle in a haystack. Diagnosing build issues or finding specific information, even in successful builds, often feels like an impossible task. This post offers some practical techniques to create better, more useful and informative build summaries in Jenkins — a DIY guide if you will.
Where standard reports fall short
There are plugins available for Jenkins that can parse standard report formats like JUnit or NUnit. JUnit, in particular, is a popular report format that most test frameworks can generate regardless of programming language. For example, many Node.js test frameworks can generate JUnit summaries that can then be parsed by these plugins.
There is also an HTML publisher plugin which can be quite useful. This plugin allows you to serve any static HTML generated as part of your build, provided you supply an HTML entrypoint file (e.g., an index.html file.
HTML reports come with a caveat, though. Some modern HTML reports cannot work effectively with many enterprise instances of Jenkins due to a strict Content-Security-Policy, which is enabled by default. Customizing this policy isn’t straightforward, especially if you have multiple teams using the same Jenkins instance, because mutating the policy applies to the entire Jenkins instance. And if your project is generating an HTML report that requires some external JavaScript or a development server, that won't work either.
There are ways to work around this security limitation, of course. For example, you could host the files on an external site — but that comes with additional operational complexities, so may not be the best option, depending on the team
Beyond these technical constraints, standard reports have other limitations. Many published test reports have limited use. Sometimes you'll want to know what happened around the time a particular test failed, and not exactly when it failed. Sometimes stack traces don't provide enough context, and that's when troubleshooting starts to get messy. You might have several log files published in each build, which means clicking through various directory levels in the build artifacts to find the associated log file — or worse, having to scroll through the dreaded console output, which contains everything.
There are some steps you can take to ensure that you have a better experience diagnosing build issues — or even getting a quick summary from a successful one.
Enter the Jenkins build description field
One feature you may not be aware of, depending on your Jenkins experience, is the build description feature. Despite improvements to Jenkins documentation over the years, this useful feature remains poorly documented, so often goes overlooked.
On the build page, the Add and Edit description buttons allow you to set this field for every build:
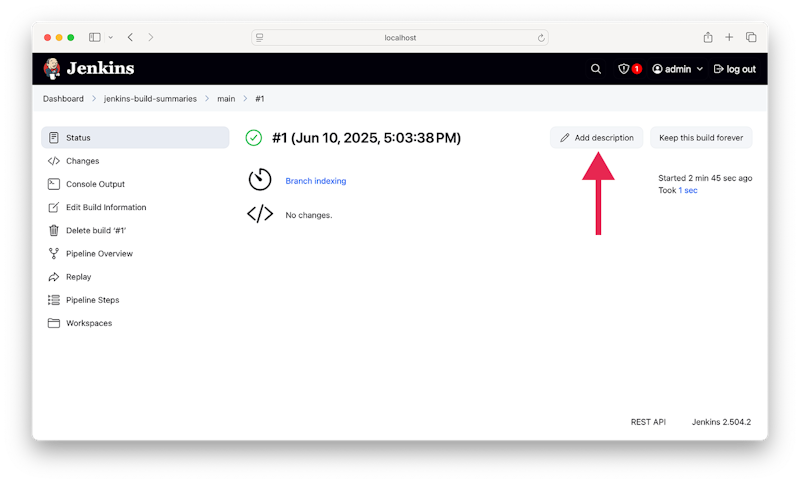
Adding a description to a Jenkins build.
For example, here’s what it looks like when I add a new description to an existing build:
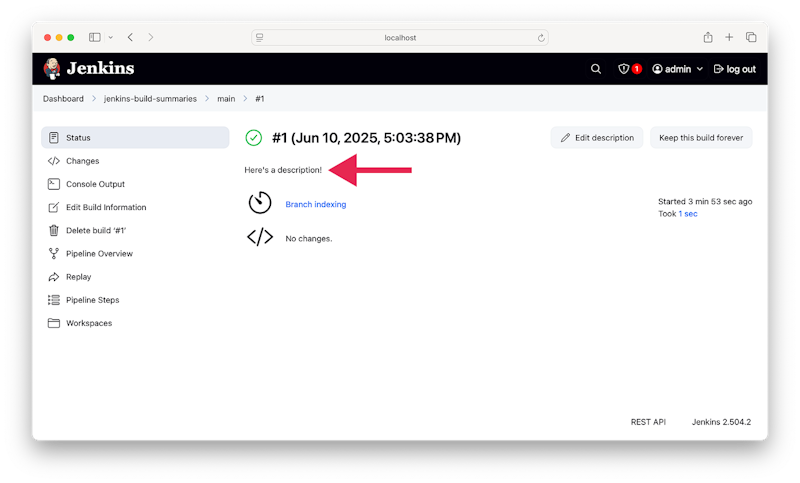
A plain-text build description.
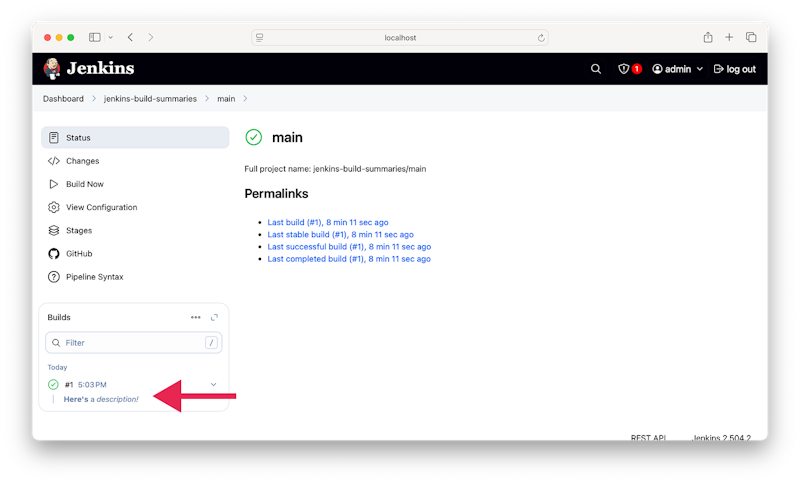
A snippet of the description also appears in the recent-builds widget on the job overview page:
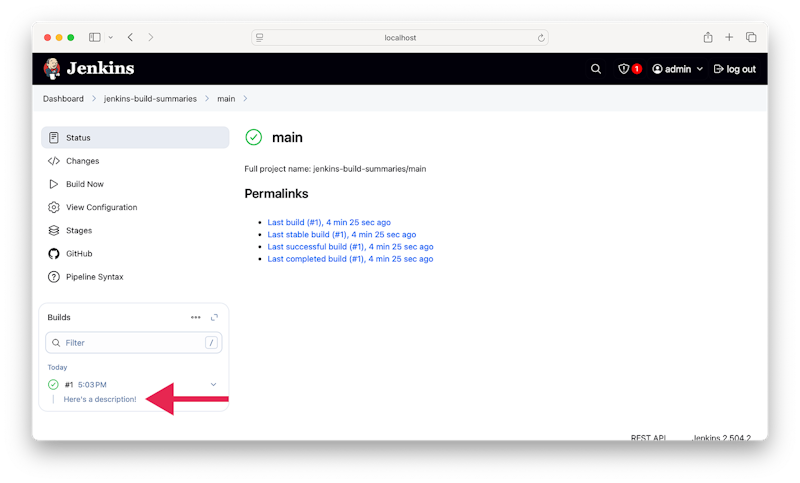
The build description in the recent-builds list.
Updating this field manually for every build probably isn't all that useful in practice. But it turns out you can also use this same field to store custom build summaries that you can create programmatically — even summaries containing HTML.
Enabling HTML formatting for better build descriptions
The previous example used plain text for the build description, though. If you were to try to enter HTML, it’ll still be displayed in the browser, but it'd be rendered as plain text. By default, Jenkins treats these descriptions as plain text to prevent cross-site scripting (XSS) attacks.
To enable HTML formatting, you'll need the OWASP Markup Formatter, which provides a safe HTML formatter rather than the default one. Installing a plugin is an administrative action, but given this particular plugin is on the list of officially recommended ones, there's a good chance you’ll be able to get the approval to install it on your Jenkins instance. Be sure to enable the Safe HTML formatter once the plugin is installed:
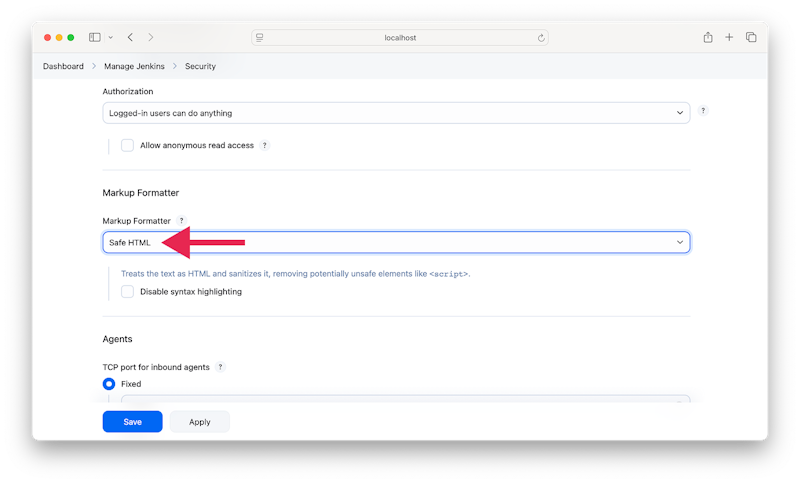
Enabling the Safe HTML markup formatter in the Jenkins security-settings view.
With the Safe HTML formatter enabled, here’s what an HTML description looks like on the build page:
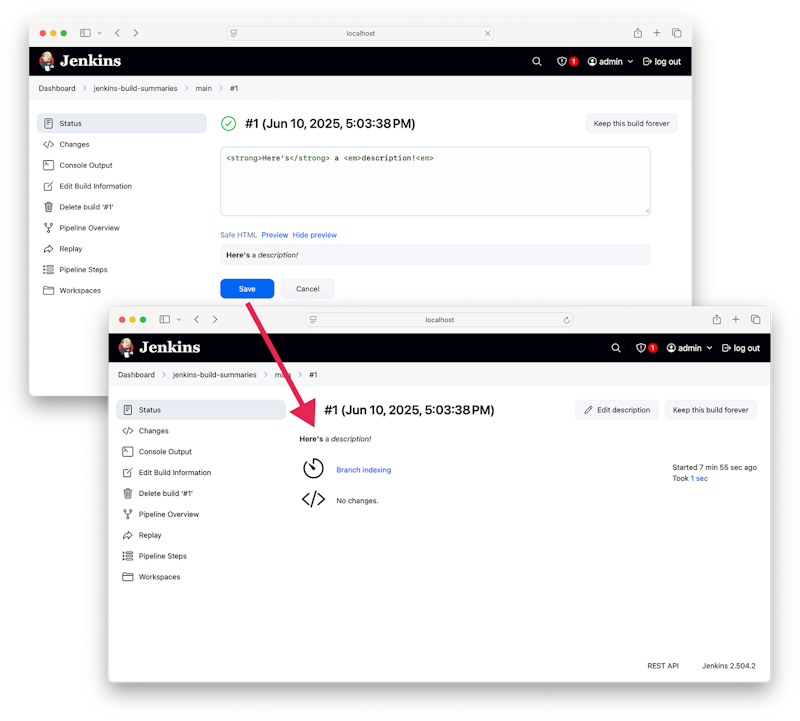
Saving and viewing an HTML build description.
It even works in the recent-builds widget!
The HTML build description in the recent-builds list.
An HTML description, even without full HTML support, is valuable because it allows you to craft useful summaries highlighting important information, possibly providing links to relevant build artifacts or to call attention to something quickly. It’s a great way to enhance the debugging experience and speed up the developer feedback loop.
Getting creative with the build description
Requires a Jenkinsfile
This section assumes you're using a Jenkinsfile — i.e., using Pipeline-as-Code. (You can use either declarative or scripted pipelines.) Achieving the same result with a classic UI-based pipeline configuration is possible, but complicated. While you can set a build description in a classic pipeline with the Build Name and Description Setter plugin, it's limited to a set of macros that the default macro expansion plugin can handle, so you have to create your own macro expander.
Now that you’ve seen what the build description feature looks like, let's take a look at how it can be used to reduce the complexity of debugging failures.
Method 1: Generate HTML build summaries with external tools
Many programming languages can generate HTML using text templates. The key requirement for this is that you’ll need data that you can inject into those templates in order to generate the markup. Once the markup is generated, you can simply set the result as the value for description field in your pipeline configuration file — i.e., the Jenkinsfile.
Let’s take a look at an example of how to do that in a Node.js project. The sample project (which uses Node only as an example; any language could be used for this) is available at:
https://github.com/cnunciato/jenkins-build-summaries
The project structure is as follows:
sum.jsis the target file that has functions to be tested.sum.test.jsis the test executed using Vitest.- Vitest supports generating JSON as well as JUnit test reports.
- If you are familiar with Vitest, you might be wondering why the HTML report isn’t used here. While we could use that, we'd have to customize the
Content-Security-Policyfor the entire Jenkins instance as described above, which again may not be feasible for many teams.
Jenkinsfileis a simple pipeline config file with a single step to run the test using Node.js.summaryGenerator/is the sample Node.js-based application we're using to generate some simple HTML markup to use as a build description — here, to summarize an error we'll be forcing for demo purposes.
The package.json file for this project contains the commands we’ll use in the Jenkinsfile. Here’s a snippet of the Jenkinsfile highlighting the post step that runs the summary generator application:
pipeline {
    // ...
    stages {
        // ...
        stage('Test') {
            // ...
            post {
                always {
                    script {

                        // Generate the summary.
                        sh 'npm run summary'

                        // Read the resulting HTML.
                        summary = sh(script: 'cat summary.html', returnStdout: true)

                        // Write it to the Jenkins build record.
                        currentBuild.description = summary
                    }
                    junit testResults: "test-report.xml"
                }
            }
        }
    }
}
This configuration produces a much more informative build overview. Notice how the Recent Builds widget now displays meaningful summaries for the test pipeline:
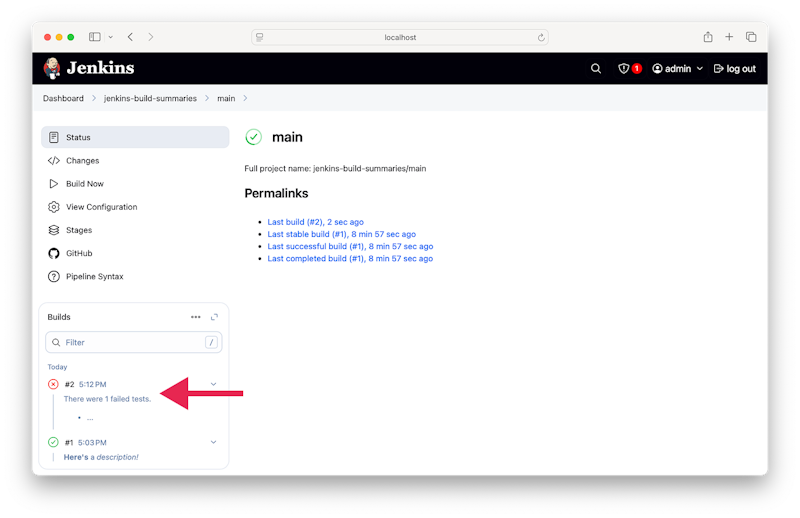
How a failed result looks in the recent-builds list.
And here's a look at that failed build's description on the build page itself:
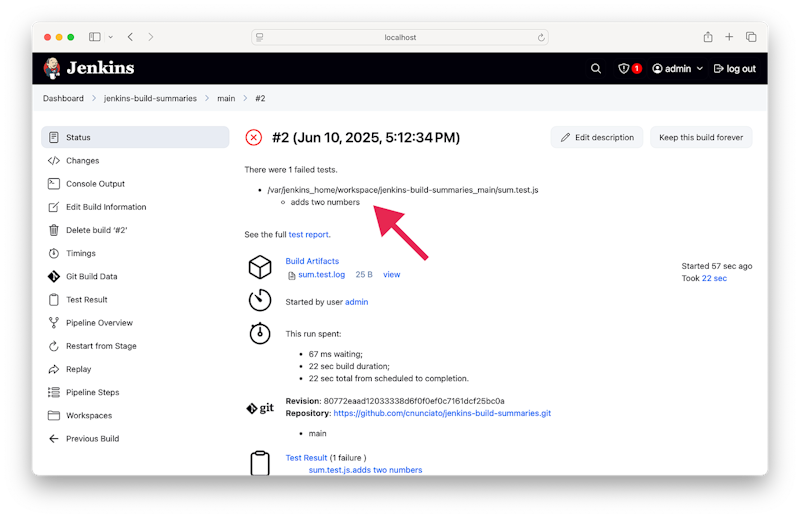
How a failed result looks on the build page.
Of course, this might feel a little redundant, since the JUnit test report that is published using Jenkins would show a similar result. The purpose of this demo is just to give you an idea of what you can accomplish with some scripting and the build description field.
Method 2: Generate build summaries with Groovy
If you'd prefer to avoid writing a separate HTML generator, you could also construct HTML summaries directly within your Jenkinsfile with Groovy. It can be a bit cumbersome and error-prone to do so, but it works. Here’s an example:
pipeline {
    // ...
    stages {
        // ...
        stage('Test') {
            // ...

            post {
                always {
                    script {
                        summary = 'Hello, '
                        summary += '<em>World!</em>'
                        currentBuild.description = summary
                    }
                    junit testResults: "test-report.xml"
                }
            }
        }
    }
}
Tips for creating useful build summaries
While every project is different, the following general guidelines will help you craft more effective build summaries:
- Generate application log files, even under test, for the different stages in your build. Using individual log files where it makes sense will help you focus on parsing through only the relevant bits, so you don’t have to scroll-through massive chunks of logs to get to what you need.
- Generate separate test-log files — don’t just write everything to
stdout/stderr. You should still write output to the console because Jenkins, like other CI platforms, uses console output to determine whether a build is stuck and to terminate the build prematurely. Also, console output is still important, and can still be a useful source of information for what went wrong in a build. - Save test reports and log files as build artifacts so you can link to the artifacts in your build summaries, and not just rely on the console output. Jenkins provides a
BUILD_URLenvironment variable for every build that you can use to construct direct links to build artifacts, making them easily accessible from your summaries. Build artifacts are stored at the relative pathartifact/<artifact-name>, where<artifact-name>is the path to whatever files you create. For example, if you saved alogsdirectory and had a file underneath it calledtest.log, then its path would be${BUILD_URL}/artifact/logs/test.log. - Ensure build status correctly reflects failures and unstable builds based on your team’s definition of both. For example, you might not want to use the Unstable build status at all, and always use the Failed status. That’ll require you to change the build status in your pipeline manually using
currentBuild.currentStatus. - Finally, use succinct, user-focused build descriptions with quick overviews of what failed and where to start looking, with links to individual log files.
Closing thoughts — and next steps
While this post may not have given you a turnkey solution that you can simply drop into your projects, we do hope it's given you some ideas for how to improve your team's Jenkins experience. The techniques we've covered, from programmatically generating HTML descriptions to organizing and linking to build artifacts, can help you cut through thousands of lines of interleaved build logs to get to the info you need to keep your team moving forward.
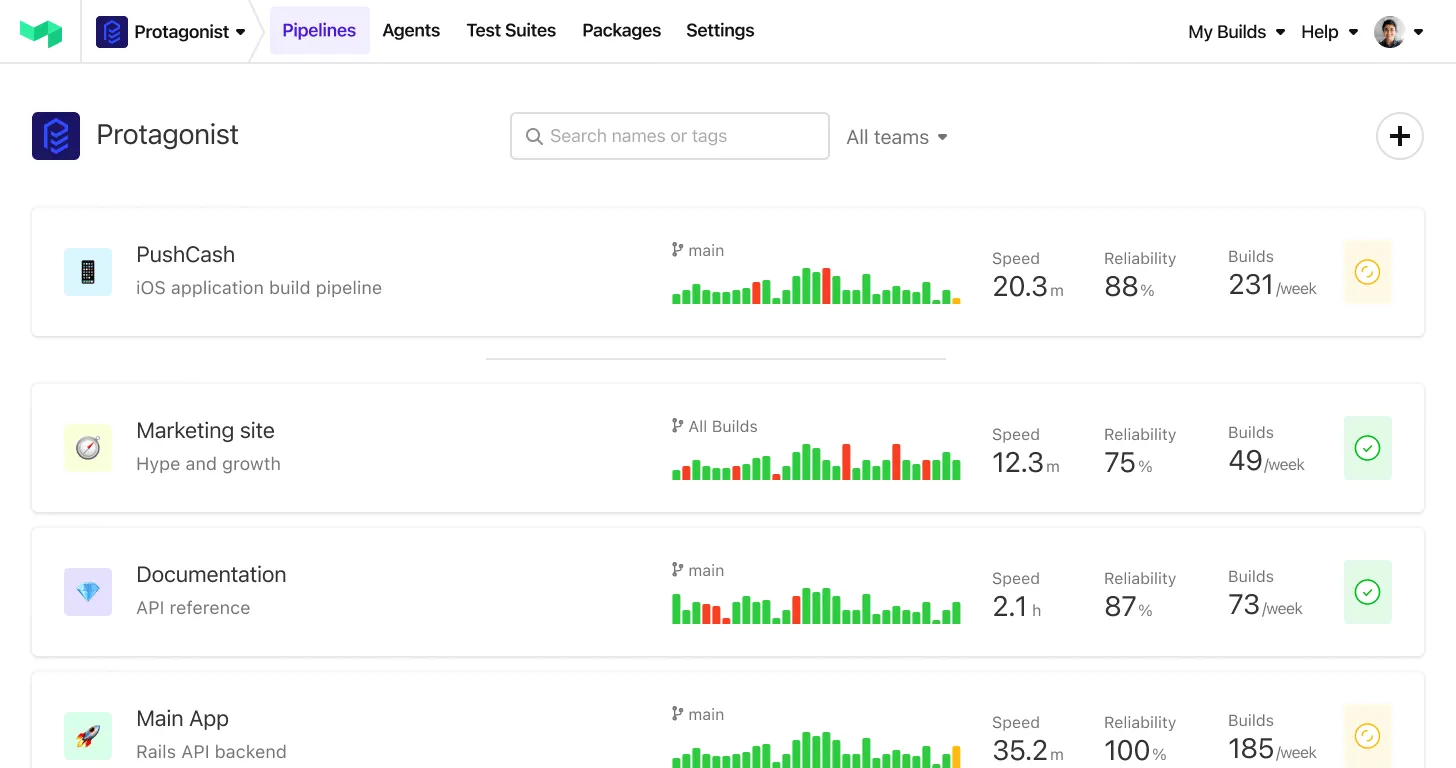
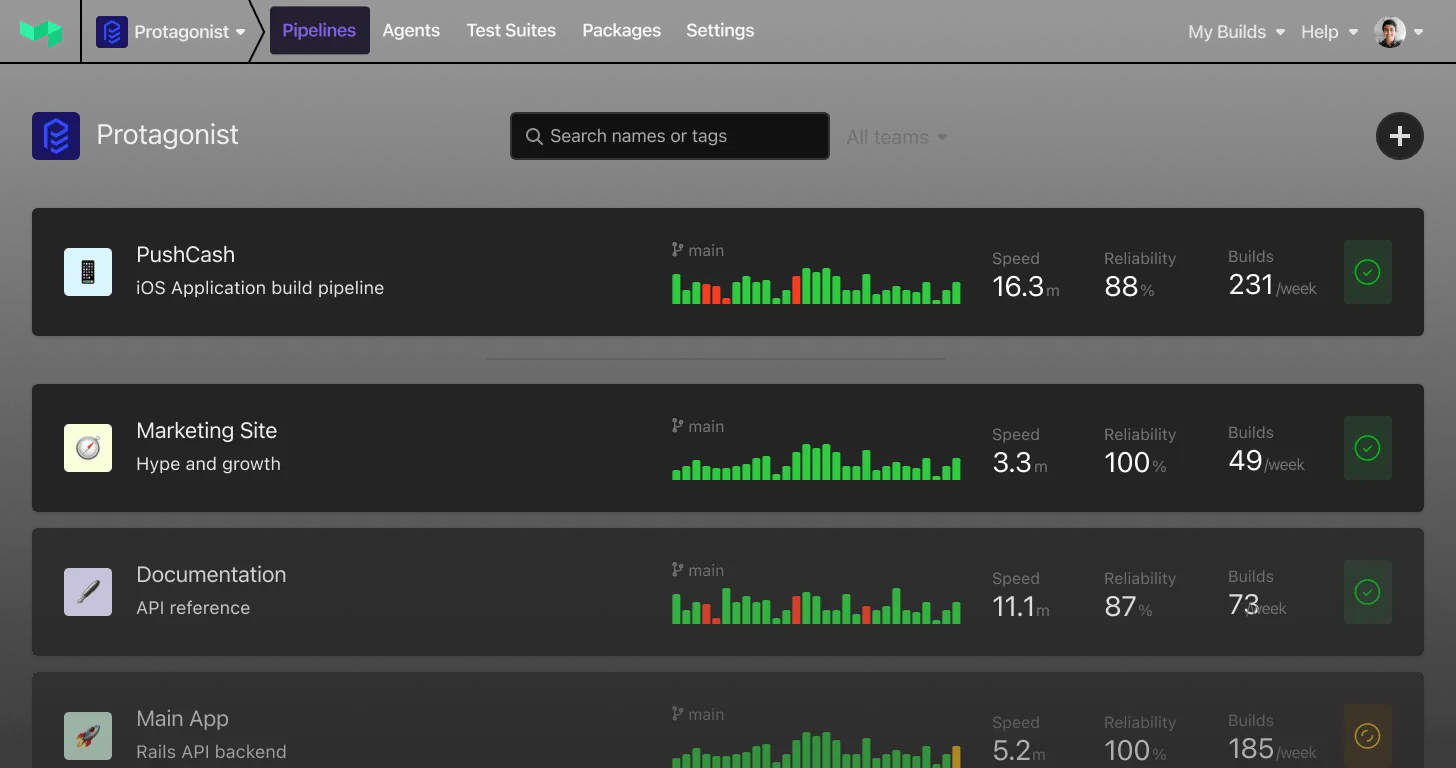
It's worth calling out that the need for more usable, developer-friendly output isn't specific to Jenkins. Every delivery platform needs it — and every one handles it a little differently. Buildkite, for example, has built-in support for creating Markdown-based build annotations, making it incredibly easy to create rich, interactive build summaries without having to write lots of custom code or templating logic:
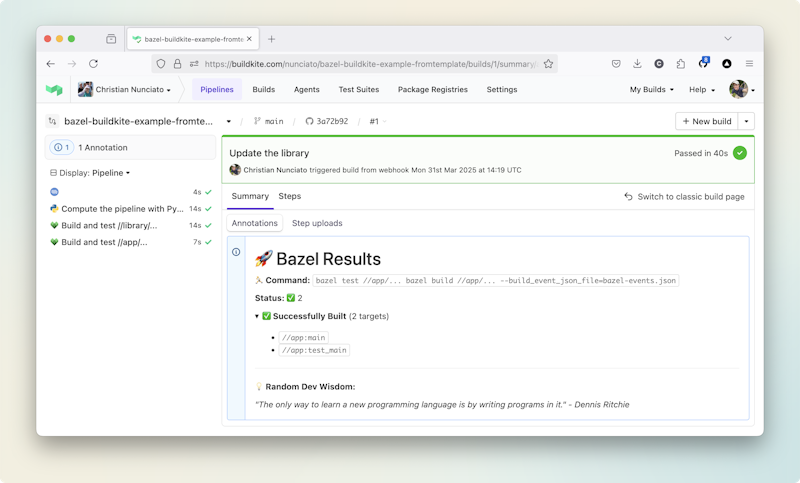
A Buildkite annotation showing the results of a Bazel build, sourced from a Bazel event protocol (BEP) file.
Regardless of which CI/CD platform you choose, the best practices are the same: organize your build outputs, highlight what matters, minimize what doesn't, and make it as easy as possible for your team to quickly understand what happened in every build.