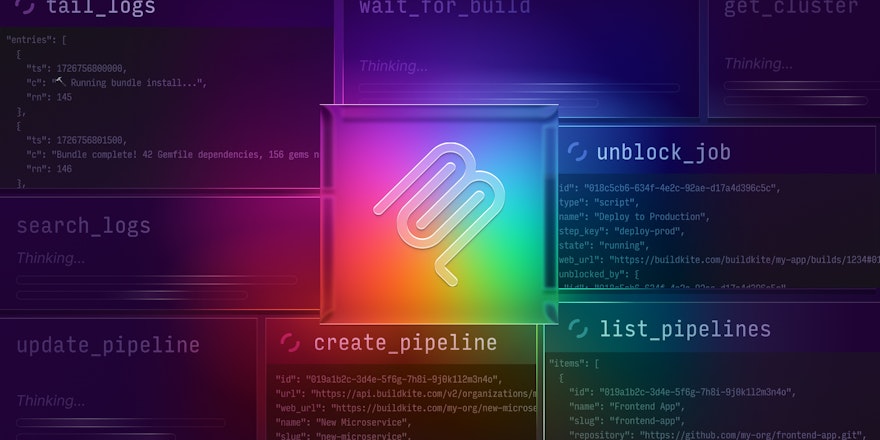
Last month, we published a high-level overview of the Buildkite MCP server and the tools it exposes. In that post, we mentioned we’d done a lot of work around more efficient log fetching, parsing, and querying. This post expands on that by telling the full story behind how we present logs in order to make them usable by agents, especially when answering questions like “Why did my build fail?”
Background on our MCP server
When originally approaching our MCP server project, we had a few goals in mind. We wanted a simple, consistent way for AI agents to work with Buildkite, and we wanted the MCP server to use the same public REST API that our users already depend on, so it wouldn't require a new surface area or a different permission model.
We built the MCP server in the open from day one. Customers found it, wired agents into their real pipelines, and started asking those agents questions like:
- How does this pipeline work?
- What is the current state of this pipeline?
- How can I improve it?
- Can you analyze the last 10 executions and identify any obvious issues?
- Are there any slow steps here that could be split up, or somehow made faster?
To help AI agents answer these questions, we began by providing a set of MCP tools that simply wrapped and returned the output of our REST API. This included returning a sanitized version of our job logs. For the most part, these tools worked — however, the first issue we had was that job logs can vary wildly in response size, especially when builds fail and return pages of stack traces or verbose debug output.
Why CI logs are a challenge for AI agents
Buildkite’s job logs are composed from the raw bytestream from a pseudo-terminal (PTY). We store the full stream because it’s the most reliable way to capture the exact sequence of events, and it allows the UI to faithfully replay whatever the job actually printed. As a result, our logs may contain ANSI escape sequences, progress bars, lines that print and then disappear, timestamps hidden inside escape sequences, and group markers for the UI.
For example, here's a screenshot of a raw build log taken from the Bun project's public Buildkite pipeline showing ANSI escape codes and timestamps encoded into the output:

This same section gets rendered in the Buildkite dashboard, however, as a single line:
2025-09-04 04:19:09 UTC remote: Counting objects: 100% (12374/12374), done.The dashboard processes and renders the log to show only the final state — but agents working with the raw stream see every intermediate update, every line clear, every escape sequence, and so on.
Our first MCP implementation exposed this output with a simple wrapper around the API endpoint that returned the full terminal stream. However, this naïve implementation didn’t yield great results on large logs. If you give an LLM a 200MB terminal stream, it'll usually start at the top of the stream and then fixate on the first error it encounters, completely missing the part of the log (often much later on) that actually caused the job to fail.
Our first attempt: a tail tool
Once it became clear that returning the full log wasn’t producing good results, the next idea was to give the LLM a way to fetch just the end of the log using a tail_logs tool. Engineers typically go to the end of the job log and scroll backwards through the results until the root cause is found, because the last error in a job is probably the one that caused the failure.
This helped a little, and a couple of external contributors even improved on the idea by experimenting with saving large logs to disk so the agent could run tail or grep on its own. But this approach had its own problems, due to our requirements for Buildkite’s MCP server:
- The MCP server needed to behave similarly in local and hosted modes. Saving logs to disk works on a developer’s machine, but not in a hosted or Dockerized scenarios — and security concerns meant that we wanted to avoid direct filesystem access anyway.
- We couldn’t assume anything about the agent’s environment. We wanted the server to work with any type of agent: chat agents, coding agents, cloud-hosted, local, etc. Relying on the agent to be able to run
greportailwas too brittle. - Different agents behaved differently. This approach really left the agent to its own devices when it came to log analysis, which was good for some agents, but not so good for others.
Once we accepted that giving agents a tail_logs tool wasn’t enough, the next question was this: What does an agent actually need in order to move through a log like a human does?
Designing log-navigation tools
When you ask an agent something like “Why did build 123 fail?” there’s a pretty reasonable path you might expect it to take:
- Look at the build status and identify any jobs that failed.
- Tail the logs for the associated job steps.
- Page through the logs around the failure to understand what actually broke.
- Check for any annotations on the build that might add context.
- Summarize what happened and point to the relevant tests, source files, or failing commands.
Humans do this naturally, but getting an agent like Claude Code or Amp to follow that path on its own can be surprisingly hard. Building on the tail tool, we needed a small set of structured tools that made the logs addressable and let the agent read them in a controlled way.
Step 1: Make the logs navigable
First, we added a preprocessing step in the MCP server that turns the stream into a line-oriented format. It strips out the ANSI codes I mentioned above, retains lines that were printed and then cleared, pulls out timestamps, records log groups, and splits the output into clean entries. The idea is just to make the log predictable so we can index into it.
After that, we write the processed log to Parquet. In the buildkite-logs library, there's a process that converts the parsed log lines, with some metadata extracted from the raw output, such as timestamps, into a Parquet file.
We defined a structured format for log entries with four columns:
timestamp: Milliseconds since epoch (Int64)content: The actual log text (String)group: The section/group name (String)flags: Metadata flags (Int32)
This format allows reading and scanning of one or all columns, which is great for filtering or aggregating.
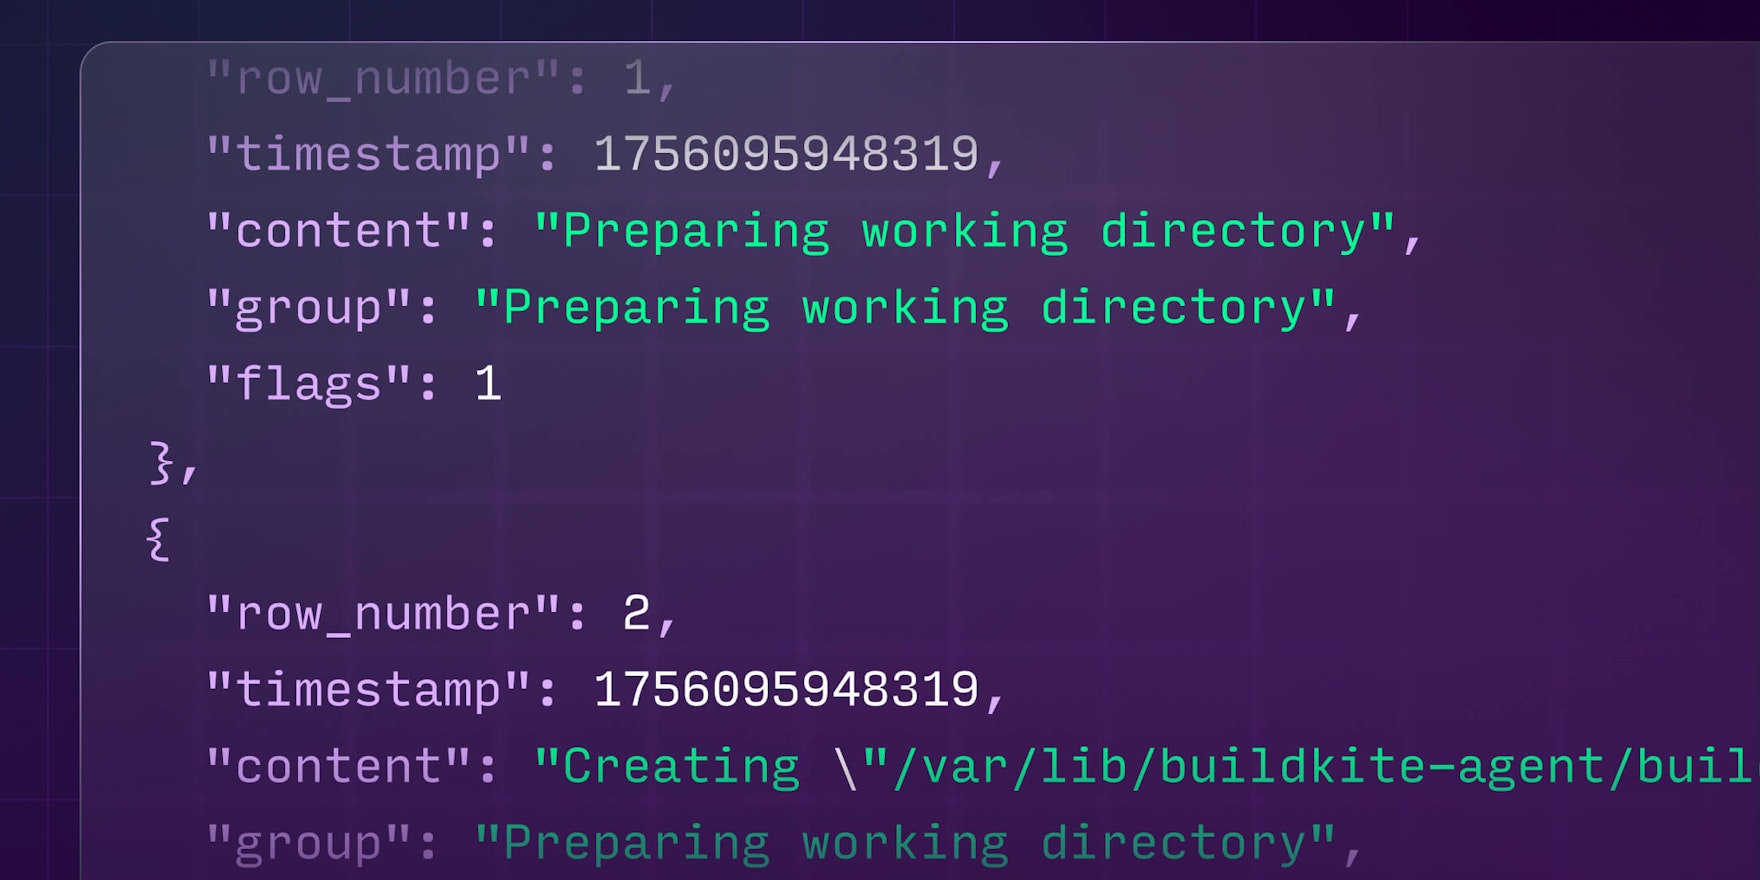
Here's what the processed output looks like when queried, with each log entry as a clean, structured record:
[
  {"row_number": 1, "timestamp": 1756095948319, "content": "Preparing working directory", "group": "Preparing working directory", "flags": 1},
  {"row_number": 2, "timestamp": 1756095948319, "content": "Creating \"/var/lib/buildkite-agent/builds/ip-172-31-90-181/bun/bun\"", "group": "Preparing working directory", "flags": 1},
  {"row_number": 3, "timestamp": 1756095948319, "content": "$ cd /var/lib/buildkite-agent/builds/ip-172-31-90-181/bun/bun", "group": "Preparing working directory", "flags": 1},
  {"row_number": 8, "timestamp": 1756095949112, "content": "remote: Enumerating objects: 12374, done.", "group": "Preparing working directory", "flags": 1},
  {"row_number": 9, "timestamp": 1756095949112, "content": "remote: Counting objects: 100% (12374/12374), done.", "group": "Preparing working directory", "flags": 1}
]
Parquet also gives us fast random access and good compression, keeping latency low for agent calls and avoiding burning tokens.
Step 2: Discover the right tools with help from Claude
Once we had our logs in Parquet format, the main issue was figuring out what the agent actually needed to follow the correct debugging path.
We used an LLM to solve this — essentially using Claude to critique itself. We’d give an agent some logs, let it make whatever tool calls it wanted to diagnose a build failure, then feed the entire trace back into a fresh Claude session and ask it to explain where its own reasoning broke down and what additional tools or description changes would've prevented that failure. Claude is extremely blunt when reviewing its own mistakes, and it reliably pointed out missing primitives and unclear tool semantics.
After a few cycles of this Claude-auditing-Claude loop, the tool surface converged, and we ended up with four log-navigation tools:
tail_logs: Returns the last N lines of a processed log (the starting point for most investigations)search_logs: Performs a regex search with optional before/after context linesread_logs: Reads a window of lines from an absolute row offset, forward or backwardget_logs_info: Returns metadata about the processed log (size, total rows, available groups, etc.)
These were enough for agents to reliably reproduce the human debugging workflow without requiring us to encode that workflow directly in an LLM prompt.
What we learned
This experience has taught us a few important lessons about AI agents:
- It’s tempting to take your REST API, wrap it in MCP tools, and assume the model will stitch everything together on its own, but this approach is rarely the best one.
- When you’re writing an MCP server, you don’t control the agent’s prompts or its overall strategy; the only leverage you have is the shape of the tools you expose. LLMs are incredibly lazy, so the goal is to make the right moves the easiest ones — rather like creating a channel for water to naturally flow downhill.
- When providing information to agents, you should avoid providing noisy, ambiguous information, otherwise the analysis or summarized information will result in highly varied quality of results. To get the most out of these systems, the tricky thing is to give them just the right amount of information related to a failure or issue.
If you'd like to explore it yourself, the Buildkite MCP server is open source and available in local and fully-hosted versions. We’ve designed it to be both a useful integration layer and a reference implementation for anyone building agentic workflows on top of CI systems.
If you do use it, we'd love to hear from you! The best way to do that is by filing an issue on GitHub, and we welcome PR contributions from the community as well. 🙌