Kubernetes is well past its “shiny new toy” phase and has become the “new boring.” Boring, when it comes to core infrastructure, is perfect: well understood, widely adopted, and stable enough to bet your build pipeline on it.
A lot of work goes into ensuring that infrastructure just works and you hardly need to notice it. In this post, we’re sharing how we’ve updated our Kubernetes support with those goals in mind. We’ve stripped down the Kubernetes Stack install, improved scaling under load, made security defaults saner, and added better support for controls and metrics.
Simpler install and safer by default
Previously, running the Buildkite Agent Stack for Kubernetes meant you needed to provide a broadly scoped GraphQL token and some very specific configuration flags: an org slug, a cluster UUID, and explicit queue tags.
We’ve shifted to REST APIs and now require just a single agent token with a tighter security scope. The stack infers the rest of the configuration and uses the cluster’s default queue (unless you tell it not to). This means setup is faster and less brittle, and the system is more secure by default.
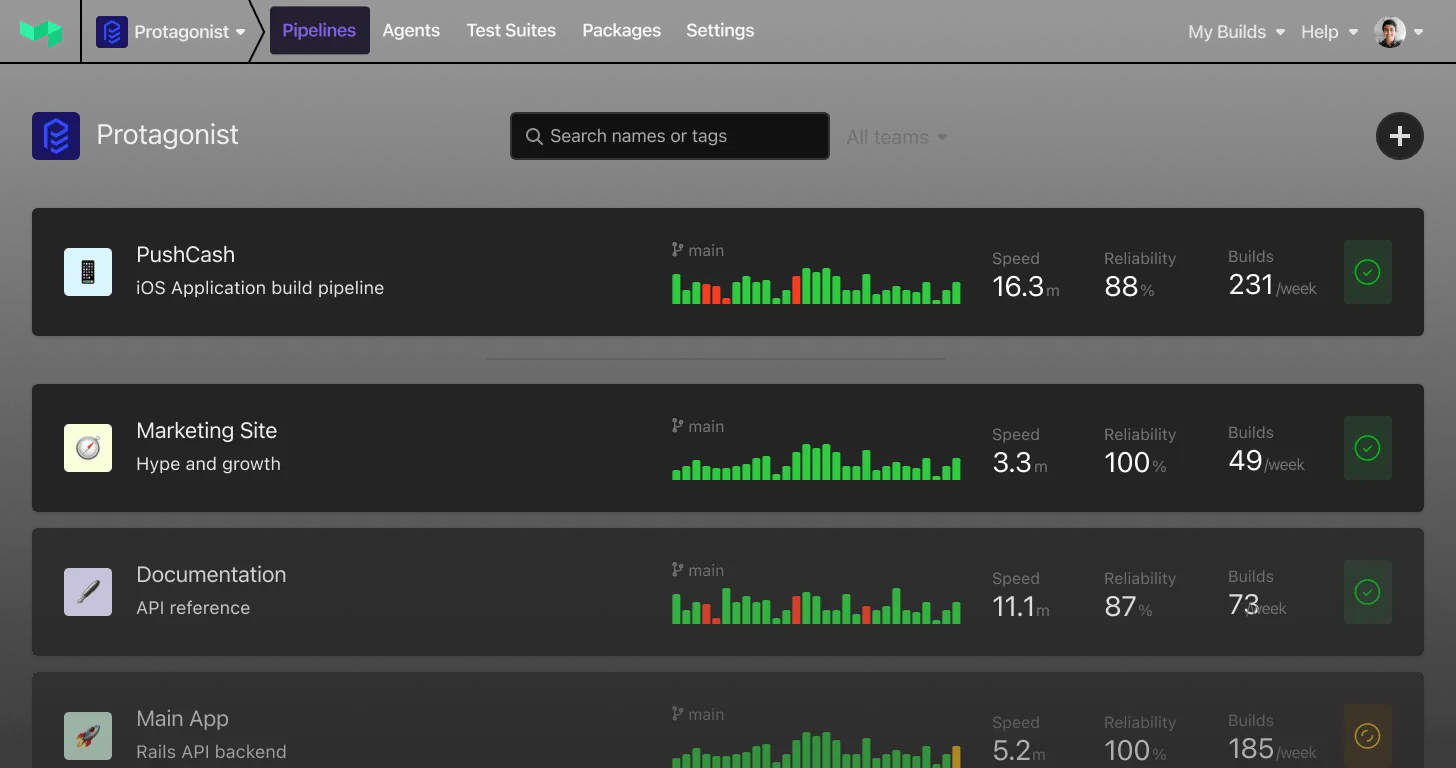
Installing and building with the Kubernetes agent stack
Better scaling under load
Running a few builds is easy. Running thousands of them concurrently across a busy cluster is a whole other story. Previously, jobs would sometimes stick around longer than our customers expected, causing concurrency caps to get tripped more often than necessary. We’ve spent the last few months smoothing these edges and reworking the controller to ensure it can handle high job volumes — e.g., tens of thousands — more efficiently.
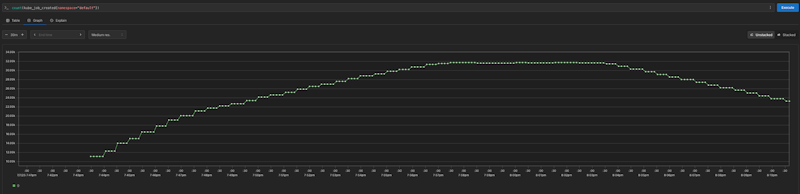
Graph showing the kube_job_created metric rising to ~32,000 jobs over a 30-minute test duration. (Step changes reflect sampling rate; job submission was continuous, so would appear linear with higher resolution.)
Environment variables — which you had to write into every pod spec (and then duplicate across containers) — now automatically pass between containers. With less info shared as environment variables, we also have much smaller Kubernetes objects — in some cases over 80% smaller — and far less churn in the cluster database. We’ve tightened up our job cleanup logic and queue routing as well, ensuring the stack spins jobs up and down much faster to avoid hitting those concurrency ceilings.
Better error surfacing
When a Kubernetes job creation fails, we now surface error messages that include the entire YAML spec for the Kubernetes Job resource, so it’s much easier to trace a misconfiguration back to the pipeline that caused it. The stack now reports K8s resource issues and failures (e.g., image not present) to differentiate them from application failures. This way, you can implement smarter automatic retries and avoid wasting resources retrying jobs before K8s is ready.
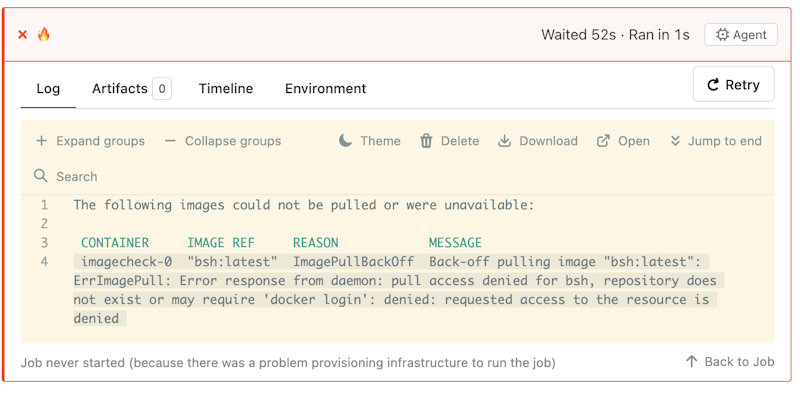
An image pull failure, with accompanying status message
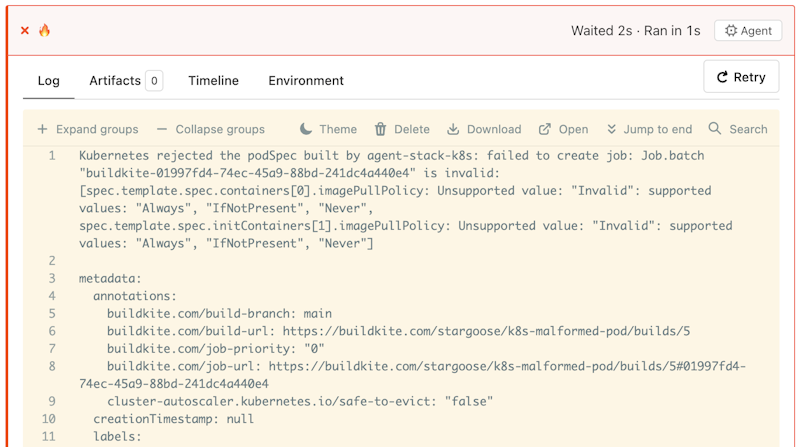
An invalid pull policy error, including the full Kubernetes pod spec
Stack-level job failures are reported with a new stack_error signal as well, so Buildkite itself has a clearer view of what went wrong. You can use Buildkite controls to surface and respond to it, including setting retry.automatic rules that key off of the error, filtering on it in your reporting queries, and configuring telemetry tools like EventBridge to forward to your platform/SRE channels rather than dev channels in case of failure.
Out-of-the-box observability
In the past, if you wanted to monitor the stack, you had to scrape Buildkite’s exported metrics with the Prometheus Operator (kube-prometheus-stack) and wire the output into custom dashboards. Our integration path is now much more straightforward:
- Install
kube-prometheus-stack - Install the Buildkite Agent Stack for Kubernetes
… and you’re done.
The metrics you care about are immediately there (job throughput, pending queues, stack health, etc.).
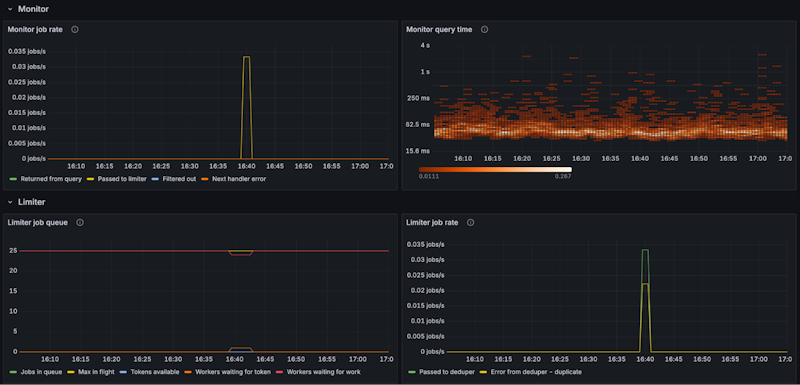
Integration with kube-prometheus-stack
Improved K8s configuration controls
Every Kubernetes deployment is slightly different, tailored to the needs every team and organization. We want Buildkite to adjust to your workflows and not the other way around, so we’re exposing even more configurations as Helm values, including:
- Job name prefixes
- Pod annotations
- CPU/memory limits
What's next
We’ve improved stability and simplified how you set up, configure, and debug your Buildkite Agent Stack on Kubernetes. We continue to roll out improvements to our K8s stack (check the Changelog for the latest!), specifically in the following areas:
- Custom scheduling: The current stack runs jobs in priority order using a simple fairness model. We’re planning to add controls soon to let customers define their own schedulers and policies — for example, if you’re running GPU-heavy training jobs or high-priority hotfix builds in a mixed-workload setting.
- More job states: Right now, when you inspect a job, you’ll find it’s either in a “not started” or “running” state. We’re working on exposing a new “preparing” state that reflects when the job is spinning up, for adding debugging and observability support.
- More fine-grained job configuration: We’re continuing to extend our REST APIs to give teams the exact hooks they need while keeping the security model tight. Want to run jobs without a checkout step or add custom metadata to a pod? You’ll be able to do that cleanly and find support from the stack itself.
Keep an eye on the agent-stack-k8s repository on GitHub and the Agent Stack for Kubernetes documentation for future updates.
Try it out
If you’re already running the Buildkite Agent Stack for Kubernetes, the jump to v0.29.2+ is one of the lowest-drama upgrades you’ll do all year:
- Drop the GraphQL token, org slug, cluster UUID, and any special queue tags
- Switch your agent token to a cluster token
- Deploy the new chart, test and validate with a representative set of pipelines, and install
kube-prometheus-stackfor instant dashboards
Here's a quick demo of the upgrade and simplified configuration process:
We hope you'll find that this update makes running CI/CD with Kubernetes on Buildkite even more boring.