Test suites overview
In Test Engine, a test suite (or suite) is a collection of tests. A suite has a run, which is the execution of tests in a suite. A pipeline's build may create one or more of these runs.
Many organizations set up one suite per test framework, for example one suite for RSpec, and another suite for Jest. Others use a common standard, such as JUnit XML, to combine tests from multiple frameworks to set up custom backend and frontend suites.
Each suite inside Test Engine has a unique API token that you can use to route test information to the correct suite. Pipelines and test suites do not need to have a one-to-one relationship.
To start configuring your test suite, you first need to have configured the appropriate test collectors for your development project. Learn more about how to do this from the Test collection section of these docs.
To delete a suite, or regenerate its API token, go to suite settings.
Parallelized builds
In CI/CD, a build's tests can be made to run in parallel using features of your own CI/CD pipeline or workflow tool. Parallelized pipeline/workflow builds typically run and complete faster than builds which are not parallelized.
In Buildkite Pipelines, you can run tests in parallel when they are configured as parallel jobs.
When tests are run in parallel across multiple agents, they can be grouped into the same run by defining the same run_env[key] environment variable. Learn more about this environment variable and others in CI environments.
You can further speed up the duration of parallelized builds across multiple agents by implementing test splitting.
Compare across branches
All test suites have a default branch so you can track trends for your most important codebase, and compare it to results across all branches.
Organizations typically choose their main production branch as their default, although this is not required.
To change your default branch, go to suite settings. You can also filter Test Engine views by any branch by typing its name into the branch query parameter in the Test Engine URL.
Tracking reliability
Test Engine calculates reliability of both your entire test suite and individual tests as a measure of flakiness over time.
Reliability is defined as percentage calculated by:
- Test suite reliability =
passed_runs / (passed_runs + failed_runs) * 100 - Individual test reliability =
passed_test_executions / (passed_test_executions + failed_test_executions) * 100
Other test execution results such as unknown and skipped are ignored in the test reliability calculation.
In Test Engine, a run is marked as failed as soon as a test execution fails, regardless of whether it passes on a retry. This helps surface unreliable tests. You can have a situation where a build eventually passes on retry in a Pipeline, and the related run is marked as failed in Test Engine.
Trends and analysis
Once your test suite is set up, you'll have many types of information automatically calculated and displayed to help you surface and investigate problems in your test suite.
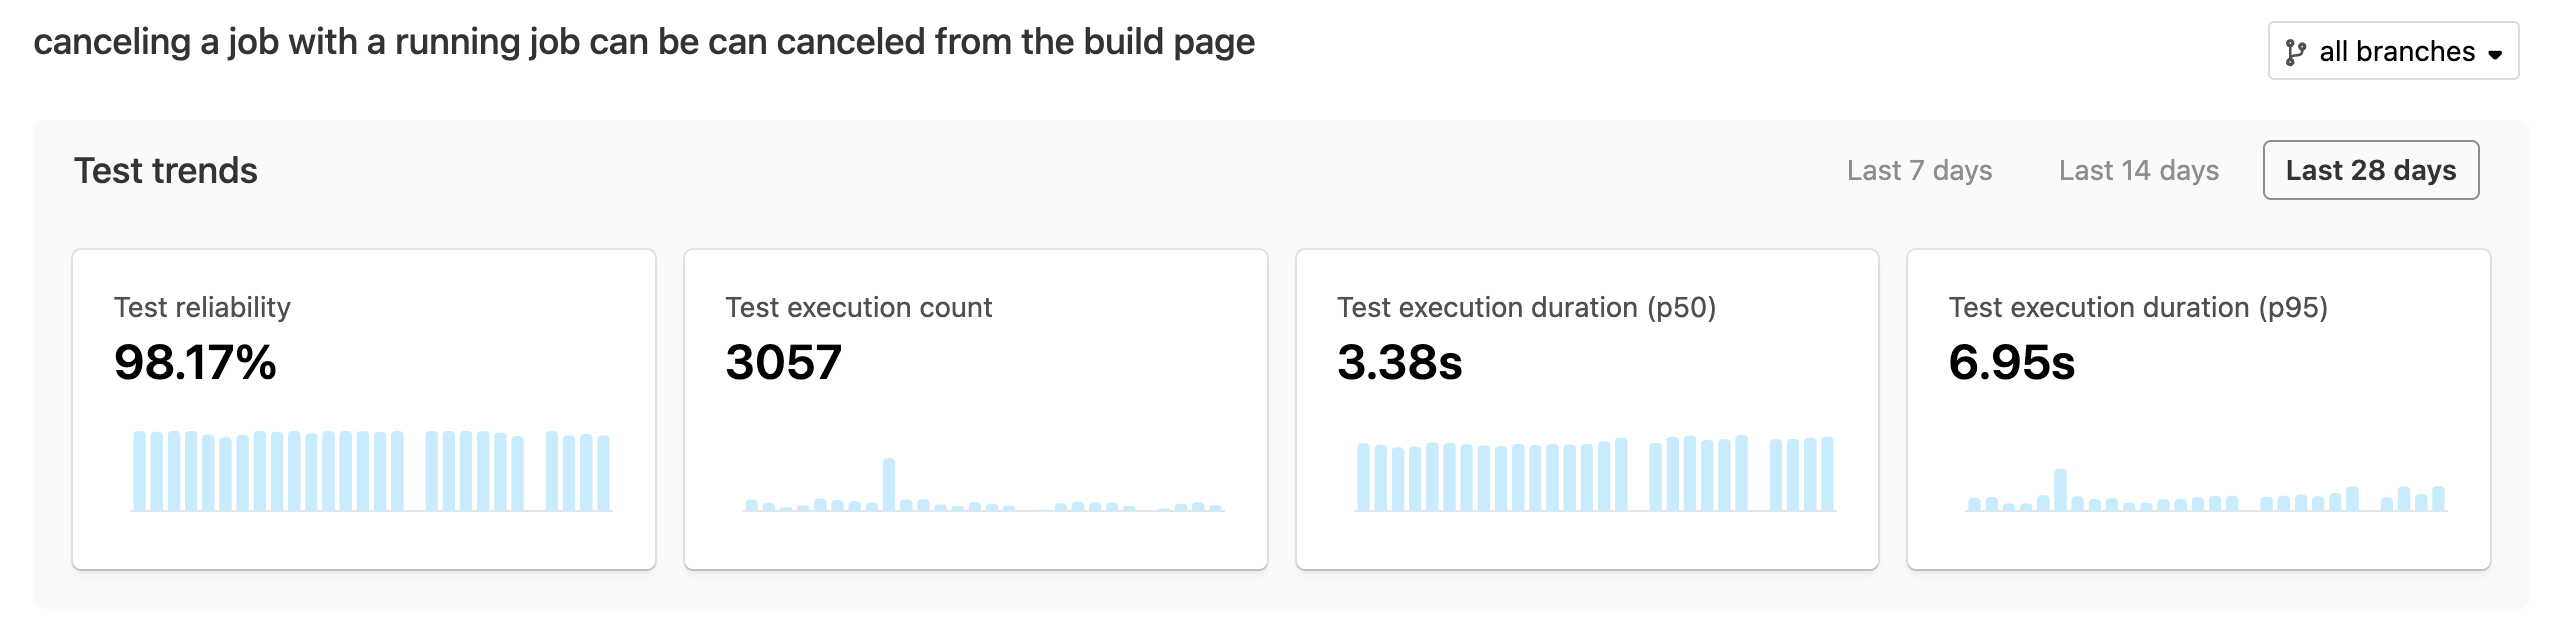
For individual tests, views include trend information on reliability, test execution count, test execution duration at p50 and p95, along with detailed information about flaky and failed test executions.
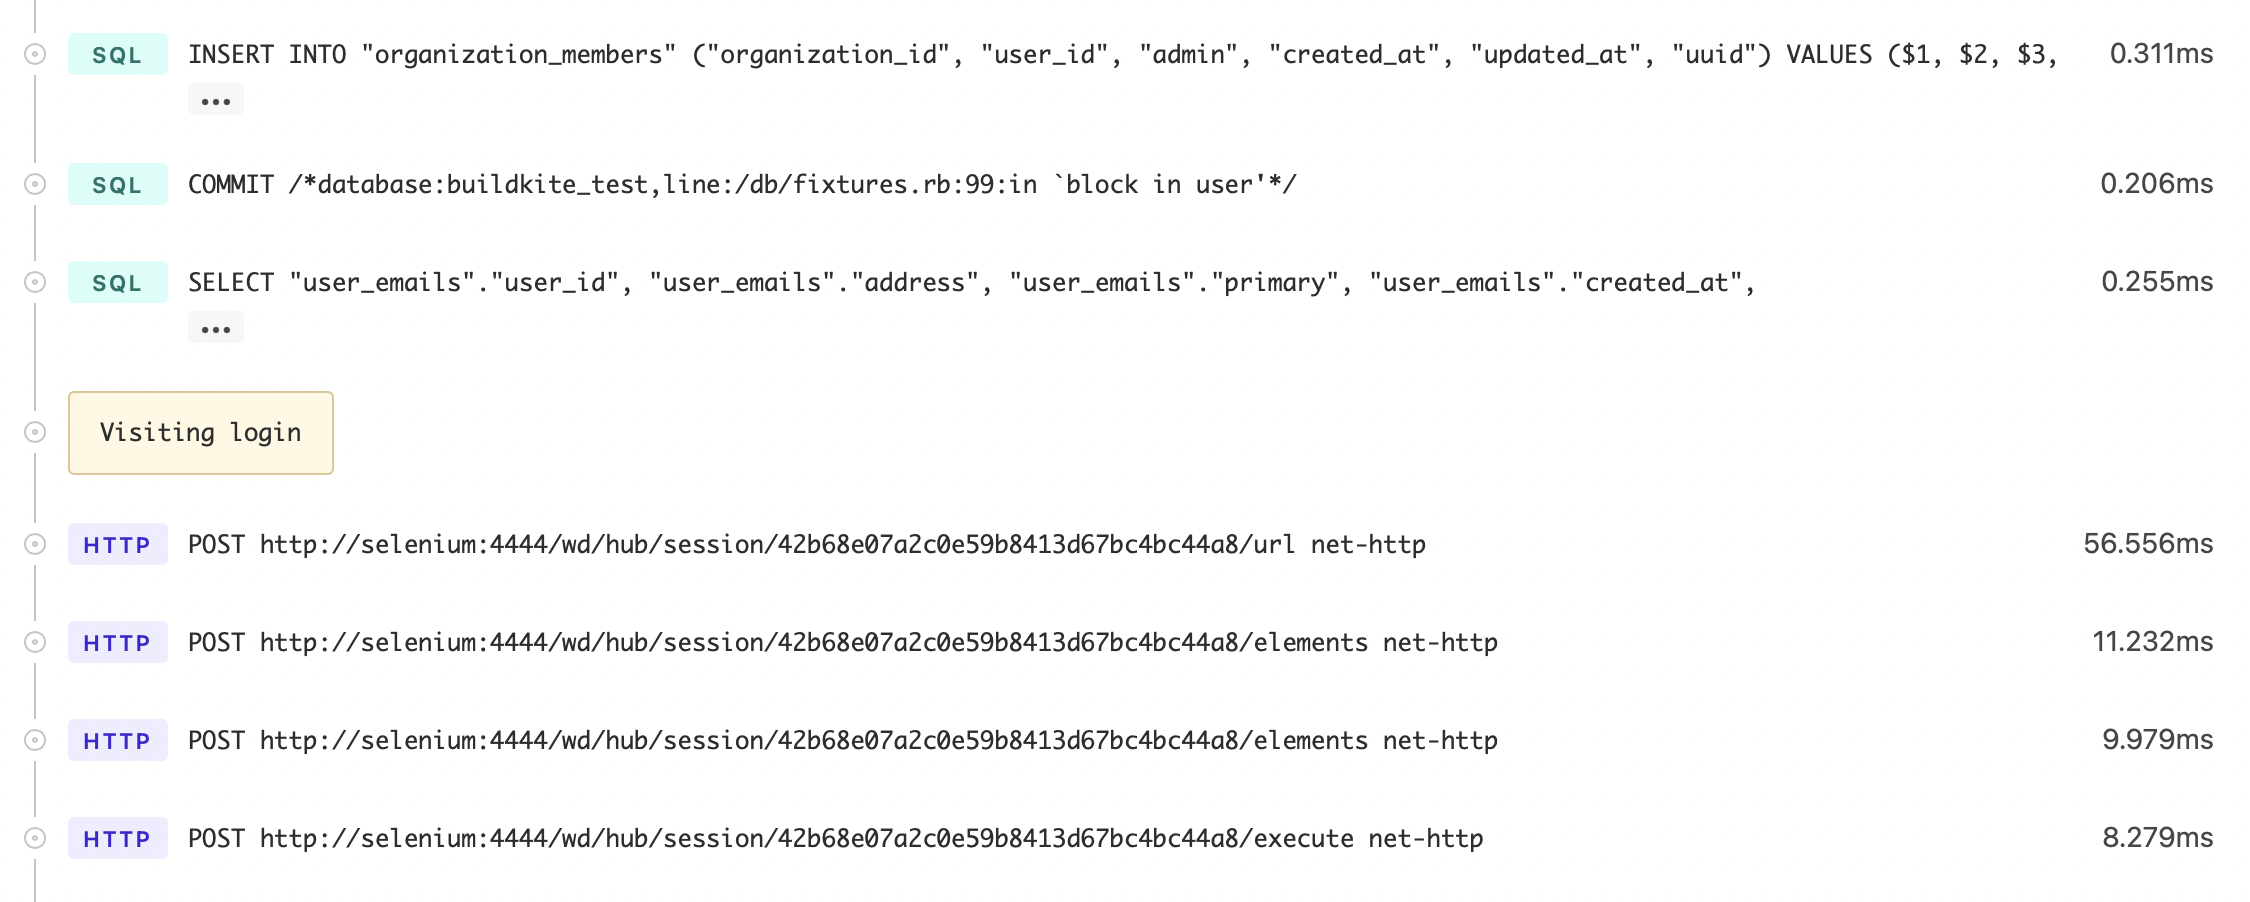
Select any individual test execution to see more trend and deep-dive information.
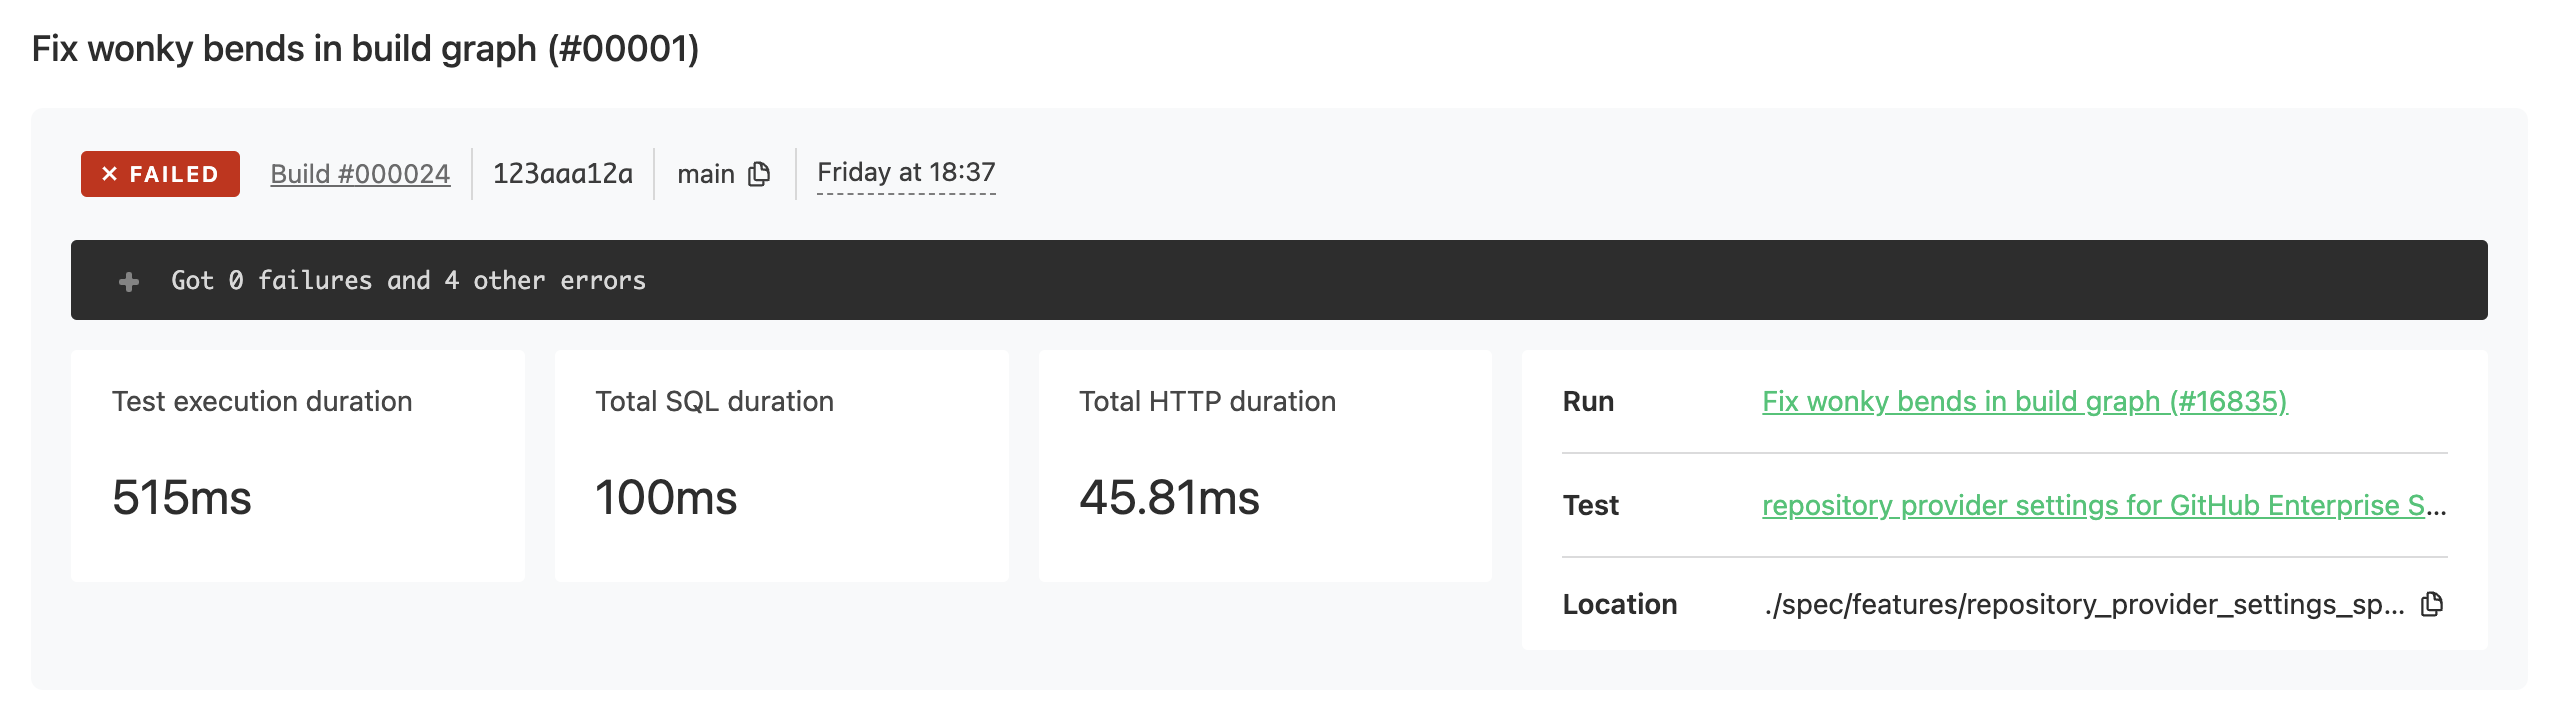
You can also annotate span information to help investigate problems, and see detailed log information inside Test Engine for any failed test or run.