Waterfall view
Waterfall is only available on Pro or Enterprise plans.
Overview
Waterfall view allows you to see build data as a waterfall chart, providing enhanced visibility into your build's job processes, durations and dependencies.
To access waterfall view:
- Navigate to any build page.
- Select View.
- Select Waterfall from the dropdown menu.
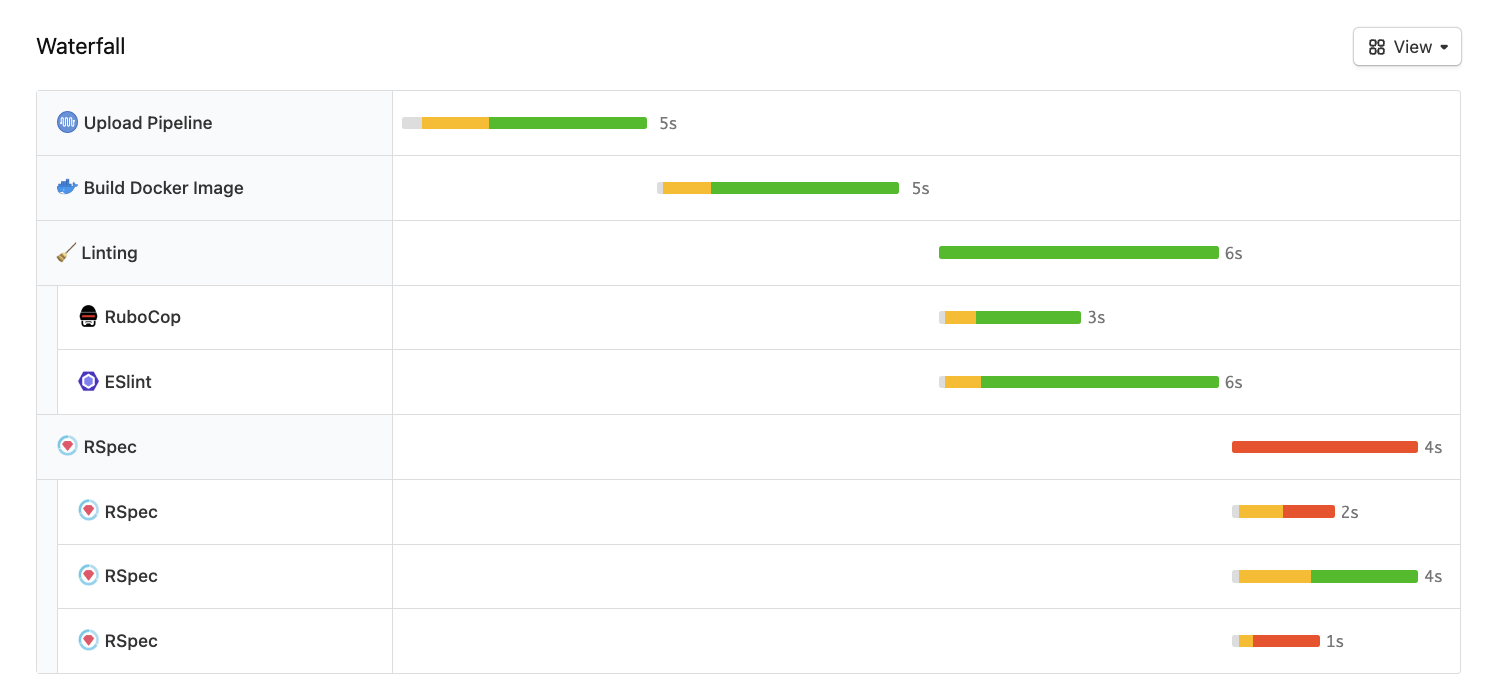
Waterfall view only displays data for finished steps. If a finished step has jobs that are canceled, timed out, expired or skipped, the row will render as blank for those jobs. Wait, block, and input steps are not included in the chart.
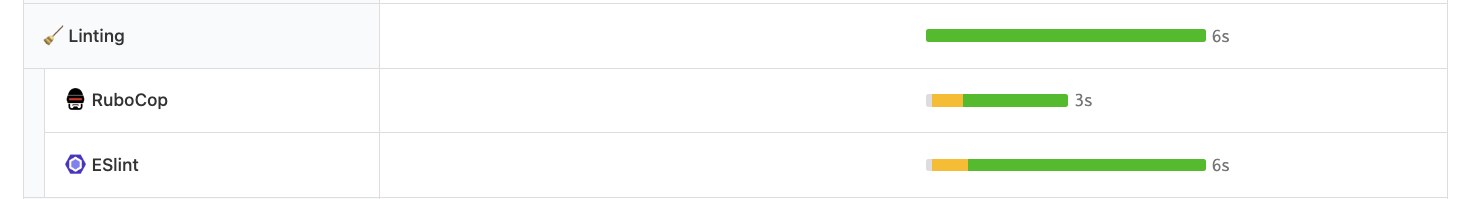
Most rows will show bars with three colored sections:
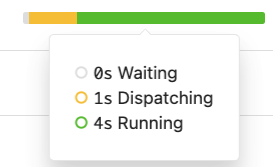
- Gray: time the job spent waiting for an agent to be assigned.
- Yellow: time elapsed since the agent was assigned, up until the time the agent started running the job.
- Green or Red: time the agent spent running the job. Displayed as green for a passed job or red for a failed job.
You can hover over a bar to view these durations. Time is rounded to the nearest second.
Group, matrix and parallel steps are shown with nested rows underneath a 'parent' row. A parent row displays a solid bar representing the total duration of its child rows. The bar is green if all child rows passed, and red if any of them failed.