
Queue metrics in clusters
Queue metrics show the most important statistics to help you optimize your agent setup and monitor a queue's performance. These statistics are updated on the page every 10 seconds.
Unclustered agents are not reported in advanced queue metrics. Learn more about unclustered agents in Unclustered agent tokens.
Metrics panels
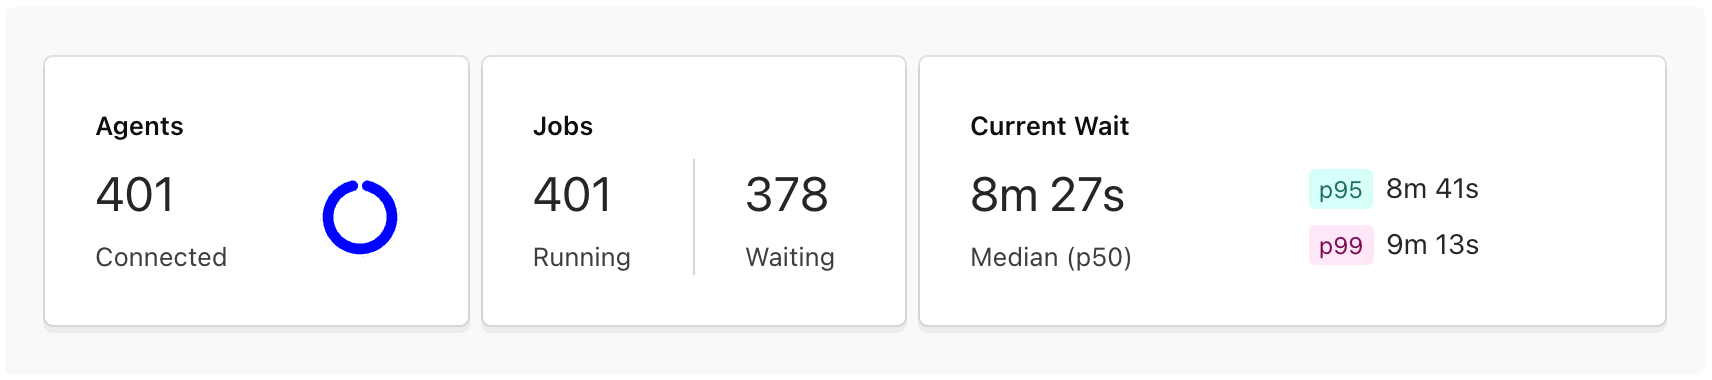
Agents panel
Agents Connected is the number of agents connected to the queue. The circular chart represents the fraction of agents that are busy working on jobs compared to those that are idle and ready for a job. Hovering over the chart shows the Agent Utilization panel, which displays the percentage values for each chart component.
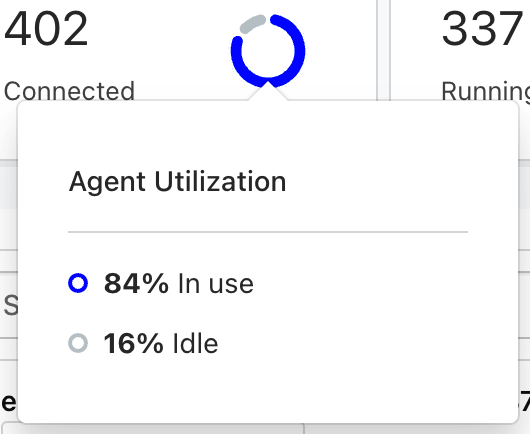
For agent utilization, agents are considered busy if they have a job ID assigned.
The number of agents shown in the agent panel includes agents in a stopping state. This may cause a variation in the number shown in the agents panel and the graph displaying connected agents.
Jobs panel
Jobs Running shows the number of jobs assigned to agents. These are any jobs in the queue in the following states:
ASSIGNEDACCEPTEDRUNNINGCANCELINGTIMING_OUT
Jobs Waiting shows the number of jobs not yet assigned to an agent. These are any jobs for the queue in the SCHEDULED state.
Current wait panel
Current Wait shows the various job wait time percentiles for this queue's waiting jobs. The percentiles represent how long it takes jobs to be assigned an agent. If there are no waiting jobs, dashes (-) are shown instead.
Advanced Queue Metrics
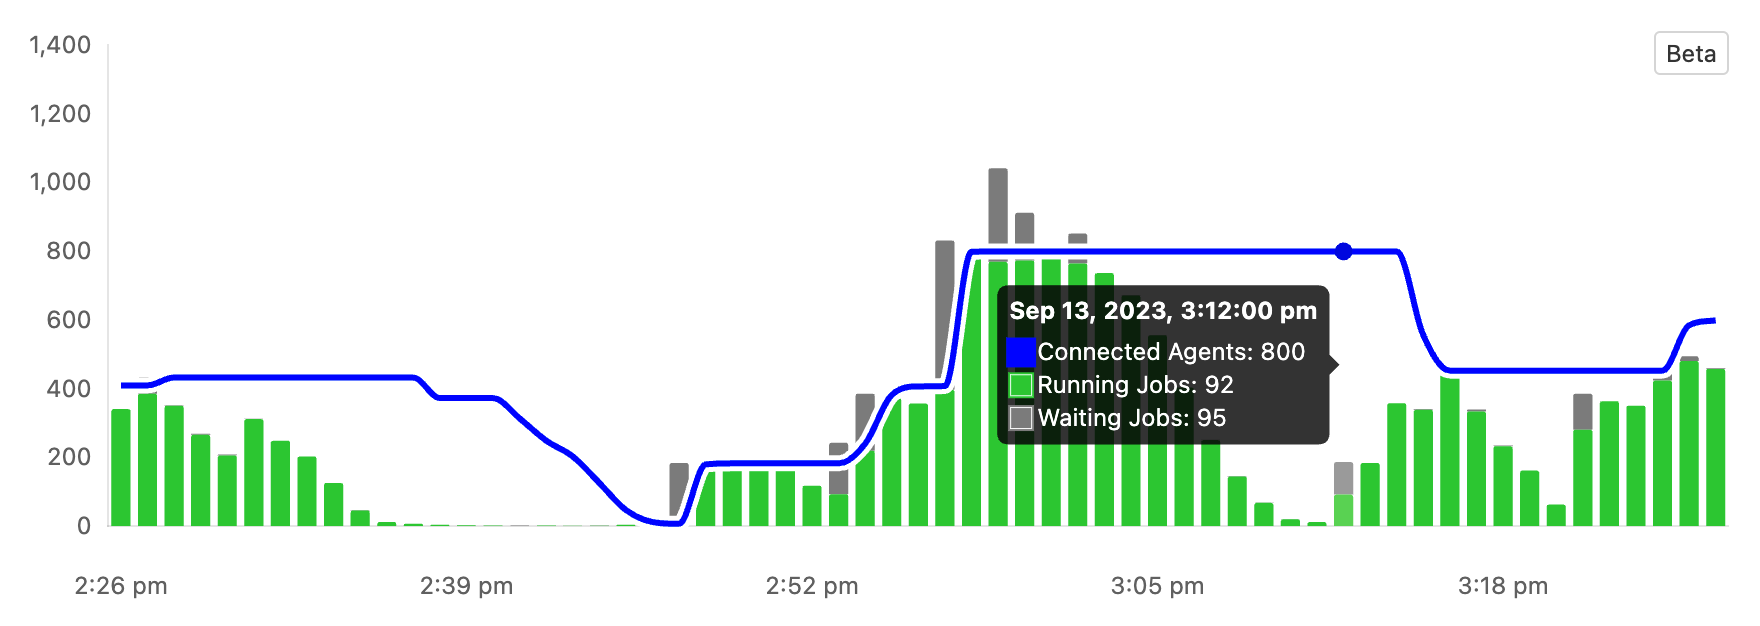
Advanced Queue Metrics show a queue’s activity from the past hour, identifying patterns in how your agents adapt to job numbers and evaluating the efficiency of your scaling rules.
-
Connected Agentsshows the number of agents that were connected to this queue -
Waiting Jobsshows the number of jobs that were waiting to be assigned an agent -
Running Jobsshows the number of jobs that have started running on an agent
The chart shows the past hour of activity with each data point representing a minute. A minute is represented by a snapshot of the metric at the end of that minute.
Advanced Queue Metrics is complimentary while in beta however it will be a separate paid product once refined and no longer a beta feature.
Enable Advanced Queue Metrics
Any Buildkite administrator can enable Advanced Queue Metrics for an organization. Once you enable Advanced Queue Metrics, you can only disable them by contacting support.
To enable Advanced Queue Metrics:
- Navigate to your organization’s pipeline settings.
- In Advanced Queue Metrics, select Enable Advanced Queue Metrics.
- Advanced Queue Metrics will now appear on your queue pages.
Immediately after enabling Advanced Queue Metrics you'll notice the Connected Agents count will be zero or
too low. This is because we only track newly connected agents once Advanced Queue Metrics is enabled.
This usually resolves itself as your agents scale down and back up.